weeknotes 109: gamification
·1 min
- io sono Gavin
- following some encouragement i started learning Italian on Duolingo – just to pick up a few phrases and words ahead of going to Italy for a holiday soon. having fun with that so far, well done Duolingo gamification
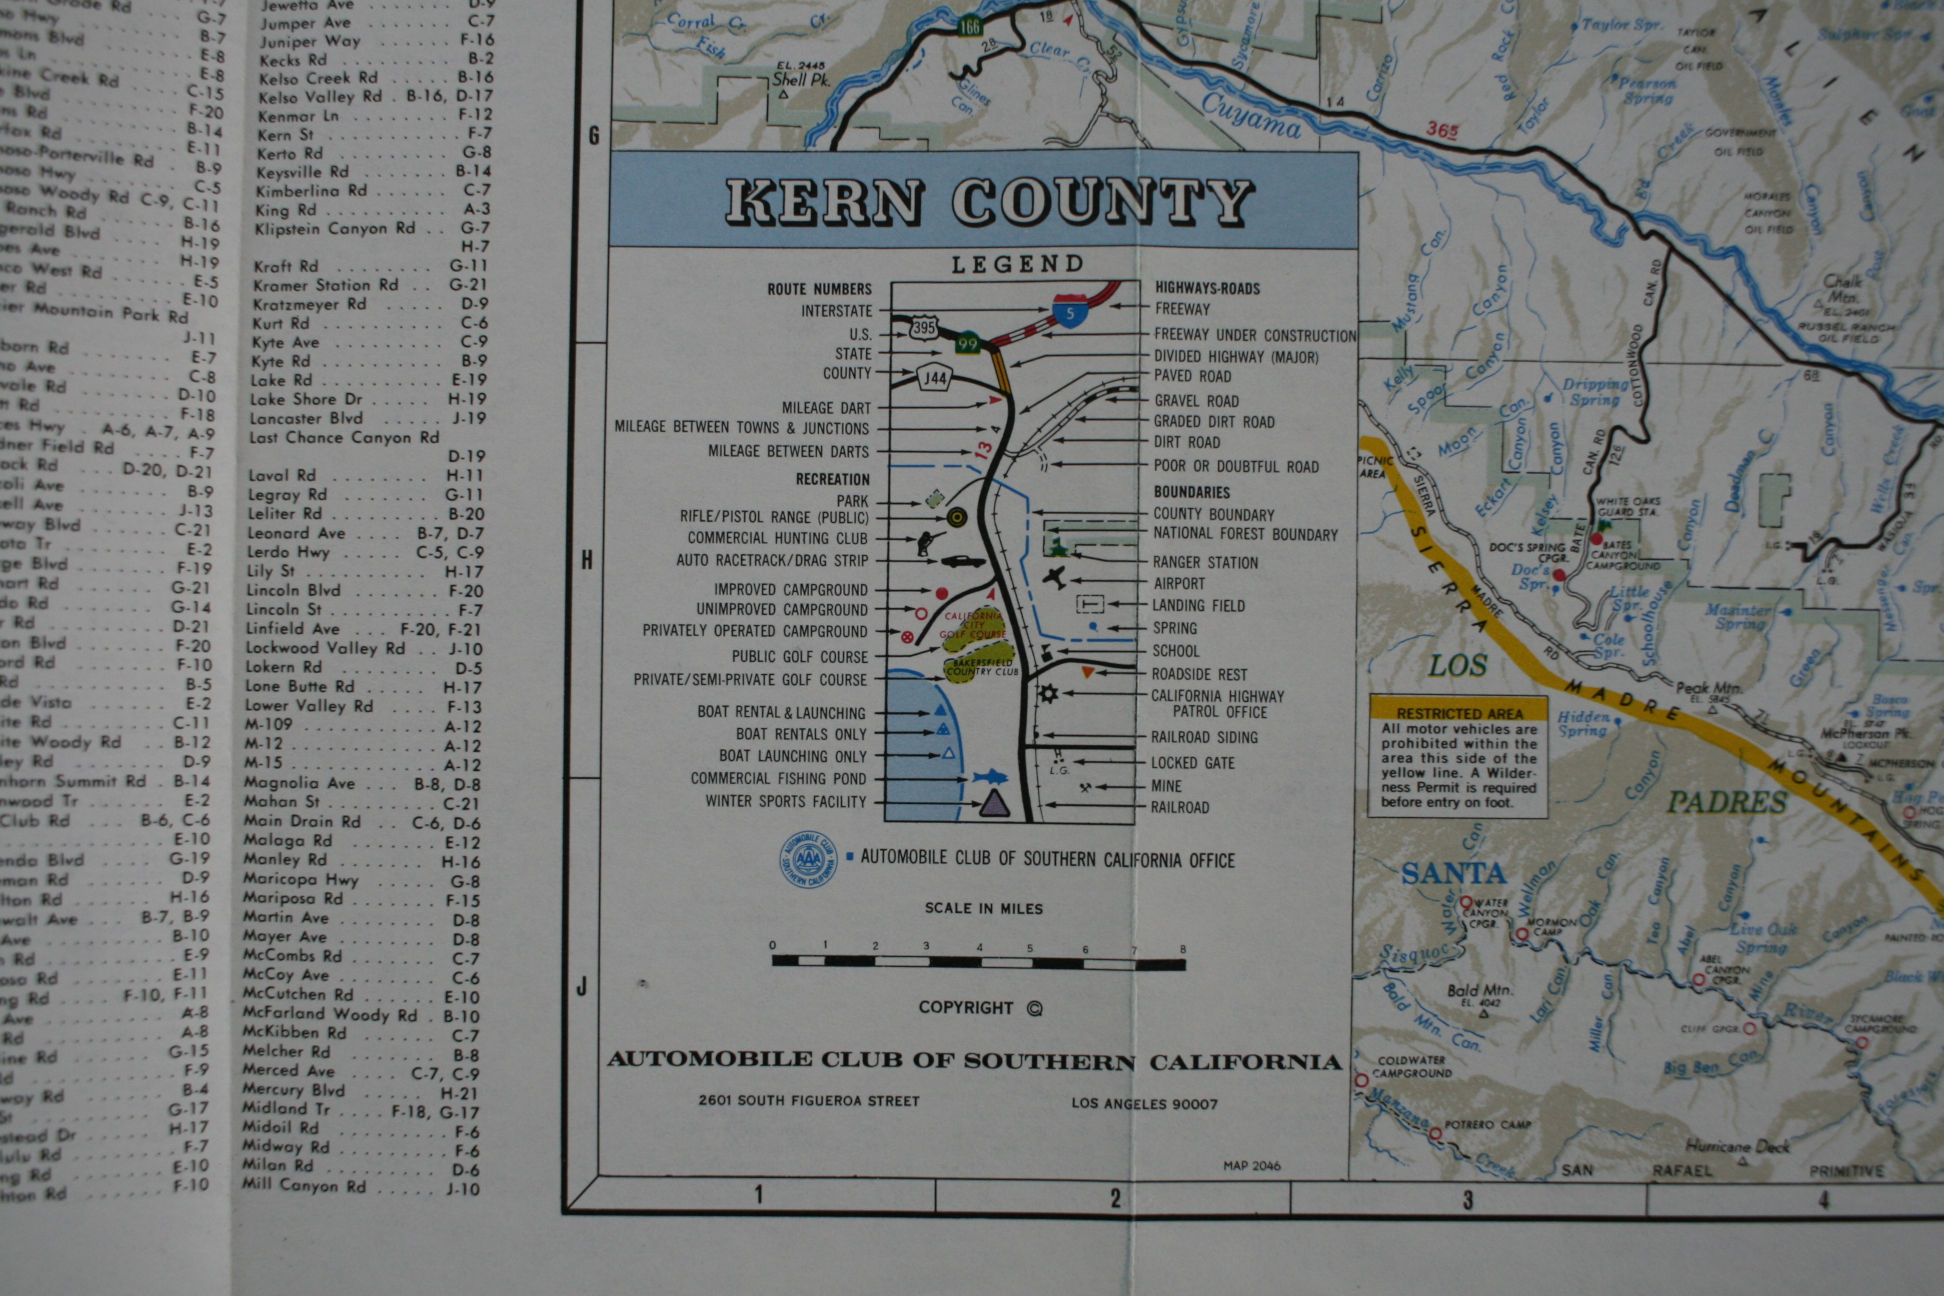
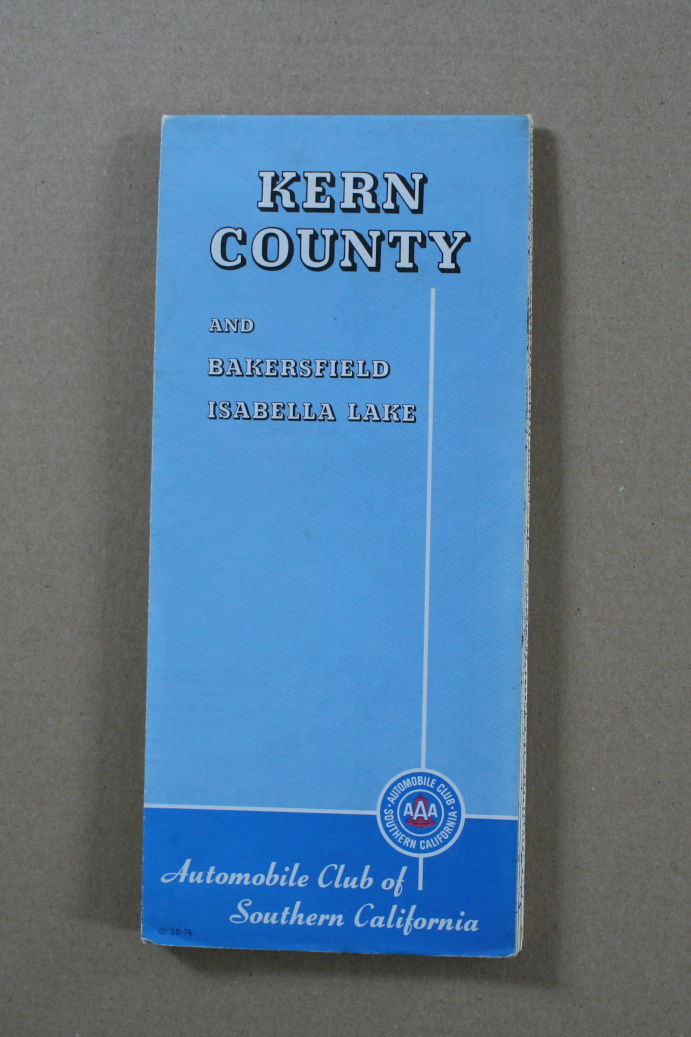
- visited a flea market and picked up a few old American road maps. one of them has a really nice legend. i like it a lot. see below.
- the acquisition of yet more random old maps has spurred the creation of a new spreadsheet, as i’ve been meaning to start cataloguing my growing collection. i hope to have a page on my website for it some day, so having a spreadsheet in addition to a vague plan feels like a good step forward.