- blog/
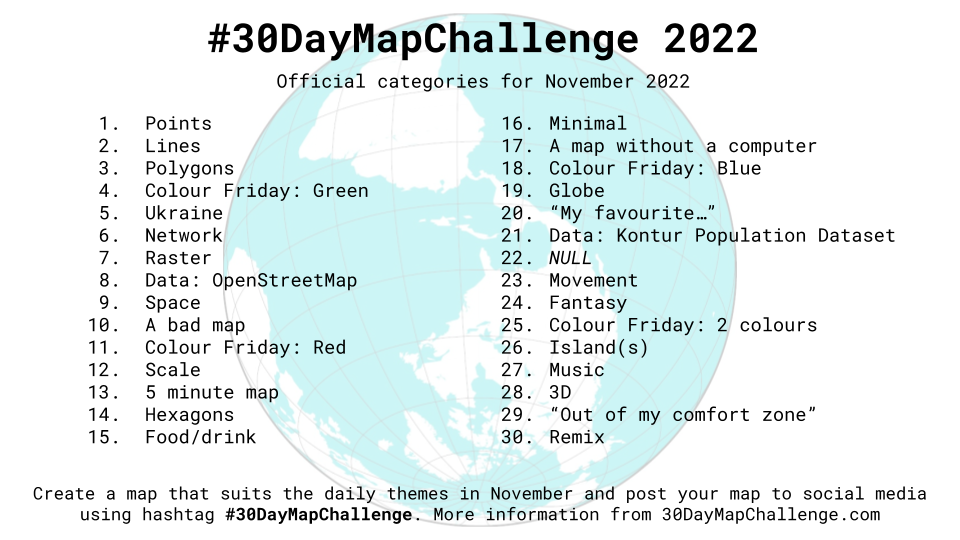
30DayMapChallenge 2022
Table of Contents
Last month I took part in my first 30DayMapChallenge – a daily mapmaking challenge that takes place in November each year.
This was my first time following the challenge live on Twitter (and Mastodon). My first encounter with the challenge was earlier in the year, through blog posts on some personal websites I stumbled across. They showcased the maps they had made and how they went about it. I’ve included a few links to such blog posts at the end if you’re hungry for more.
I had a lot of fun and saw a lot of amazing maps from everyone taking part. I thoroughly surprised myself by posting on 20 of 30 days – I thought I’d only make a handful or so!
These were the daily themes from 30DayMapChallenge 2022:
And these were the maps I made…
Powerplant Pastels #
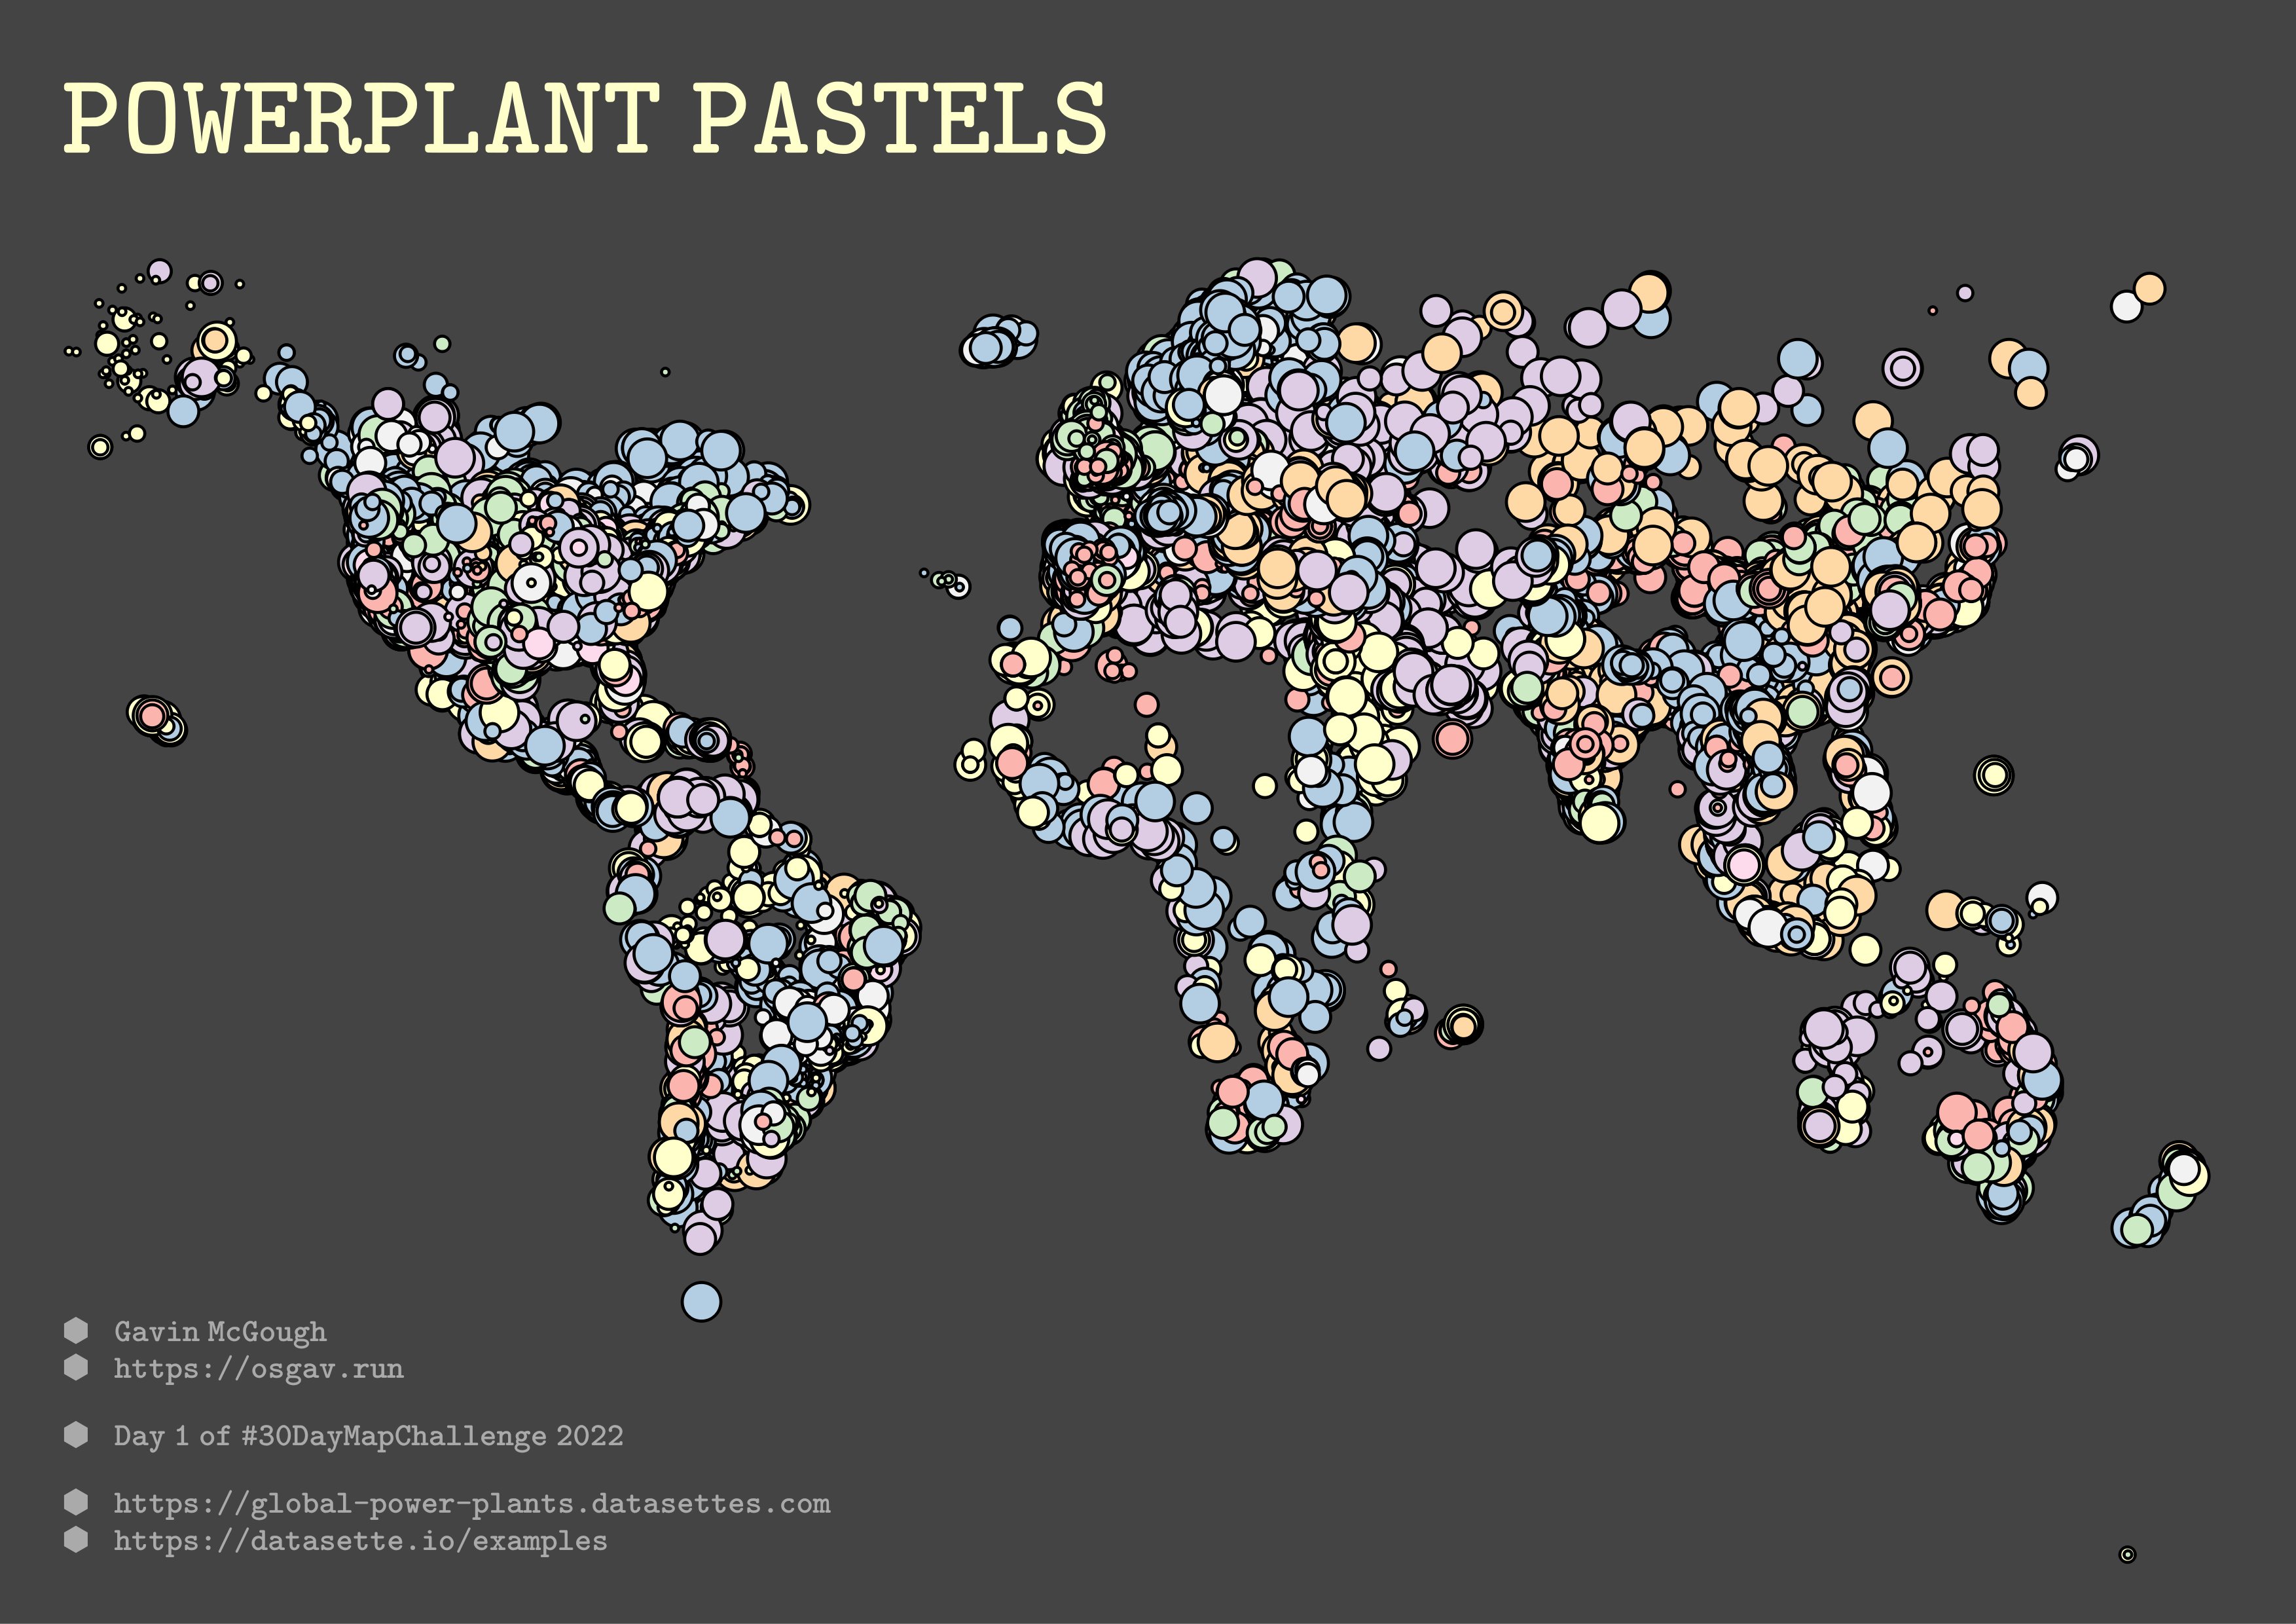
Data: Global Power Plants via Datasette
Tools: QGIS
Techniques: graduated symbol based on size (capacity_mw field), and an expression to vary the colour (primary_fuel field)
Related Links: Alasdair Rae https://www.statsmapsnpix.com/2022/10/cometmaps.html (for the expression) and Cynthia Brewer https://colorbrewer2.org/#type=qualitative&scheme=Pastel1&n=9
Social Media: view on Twitter or Mastodon
House for sale #
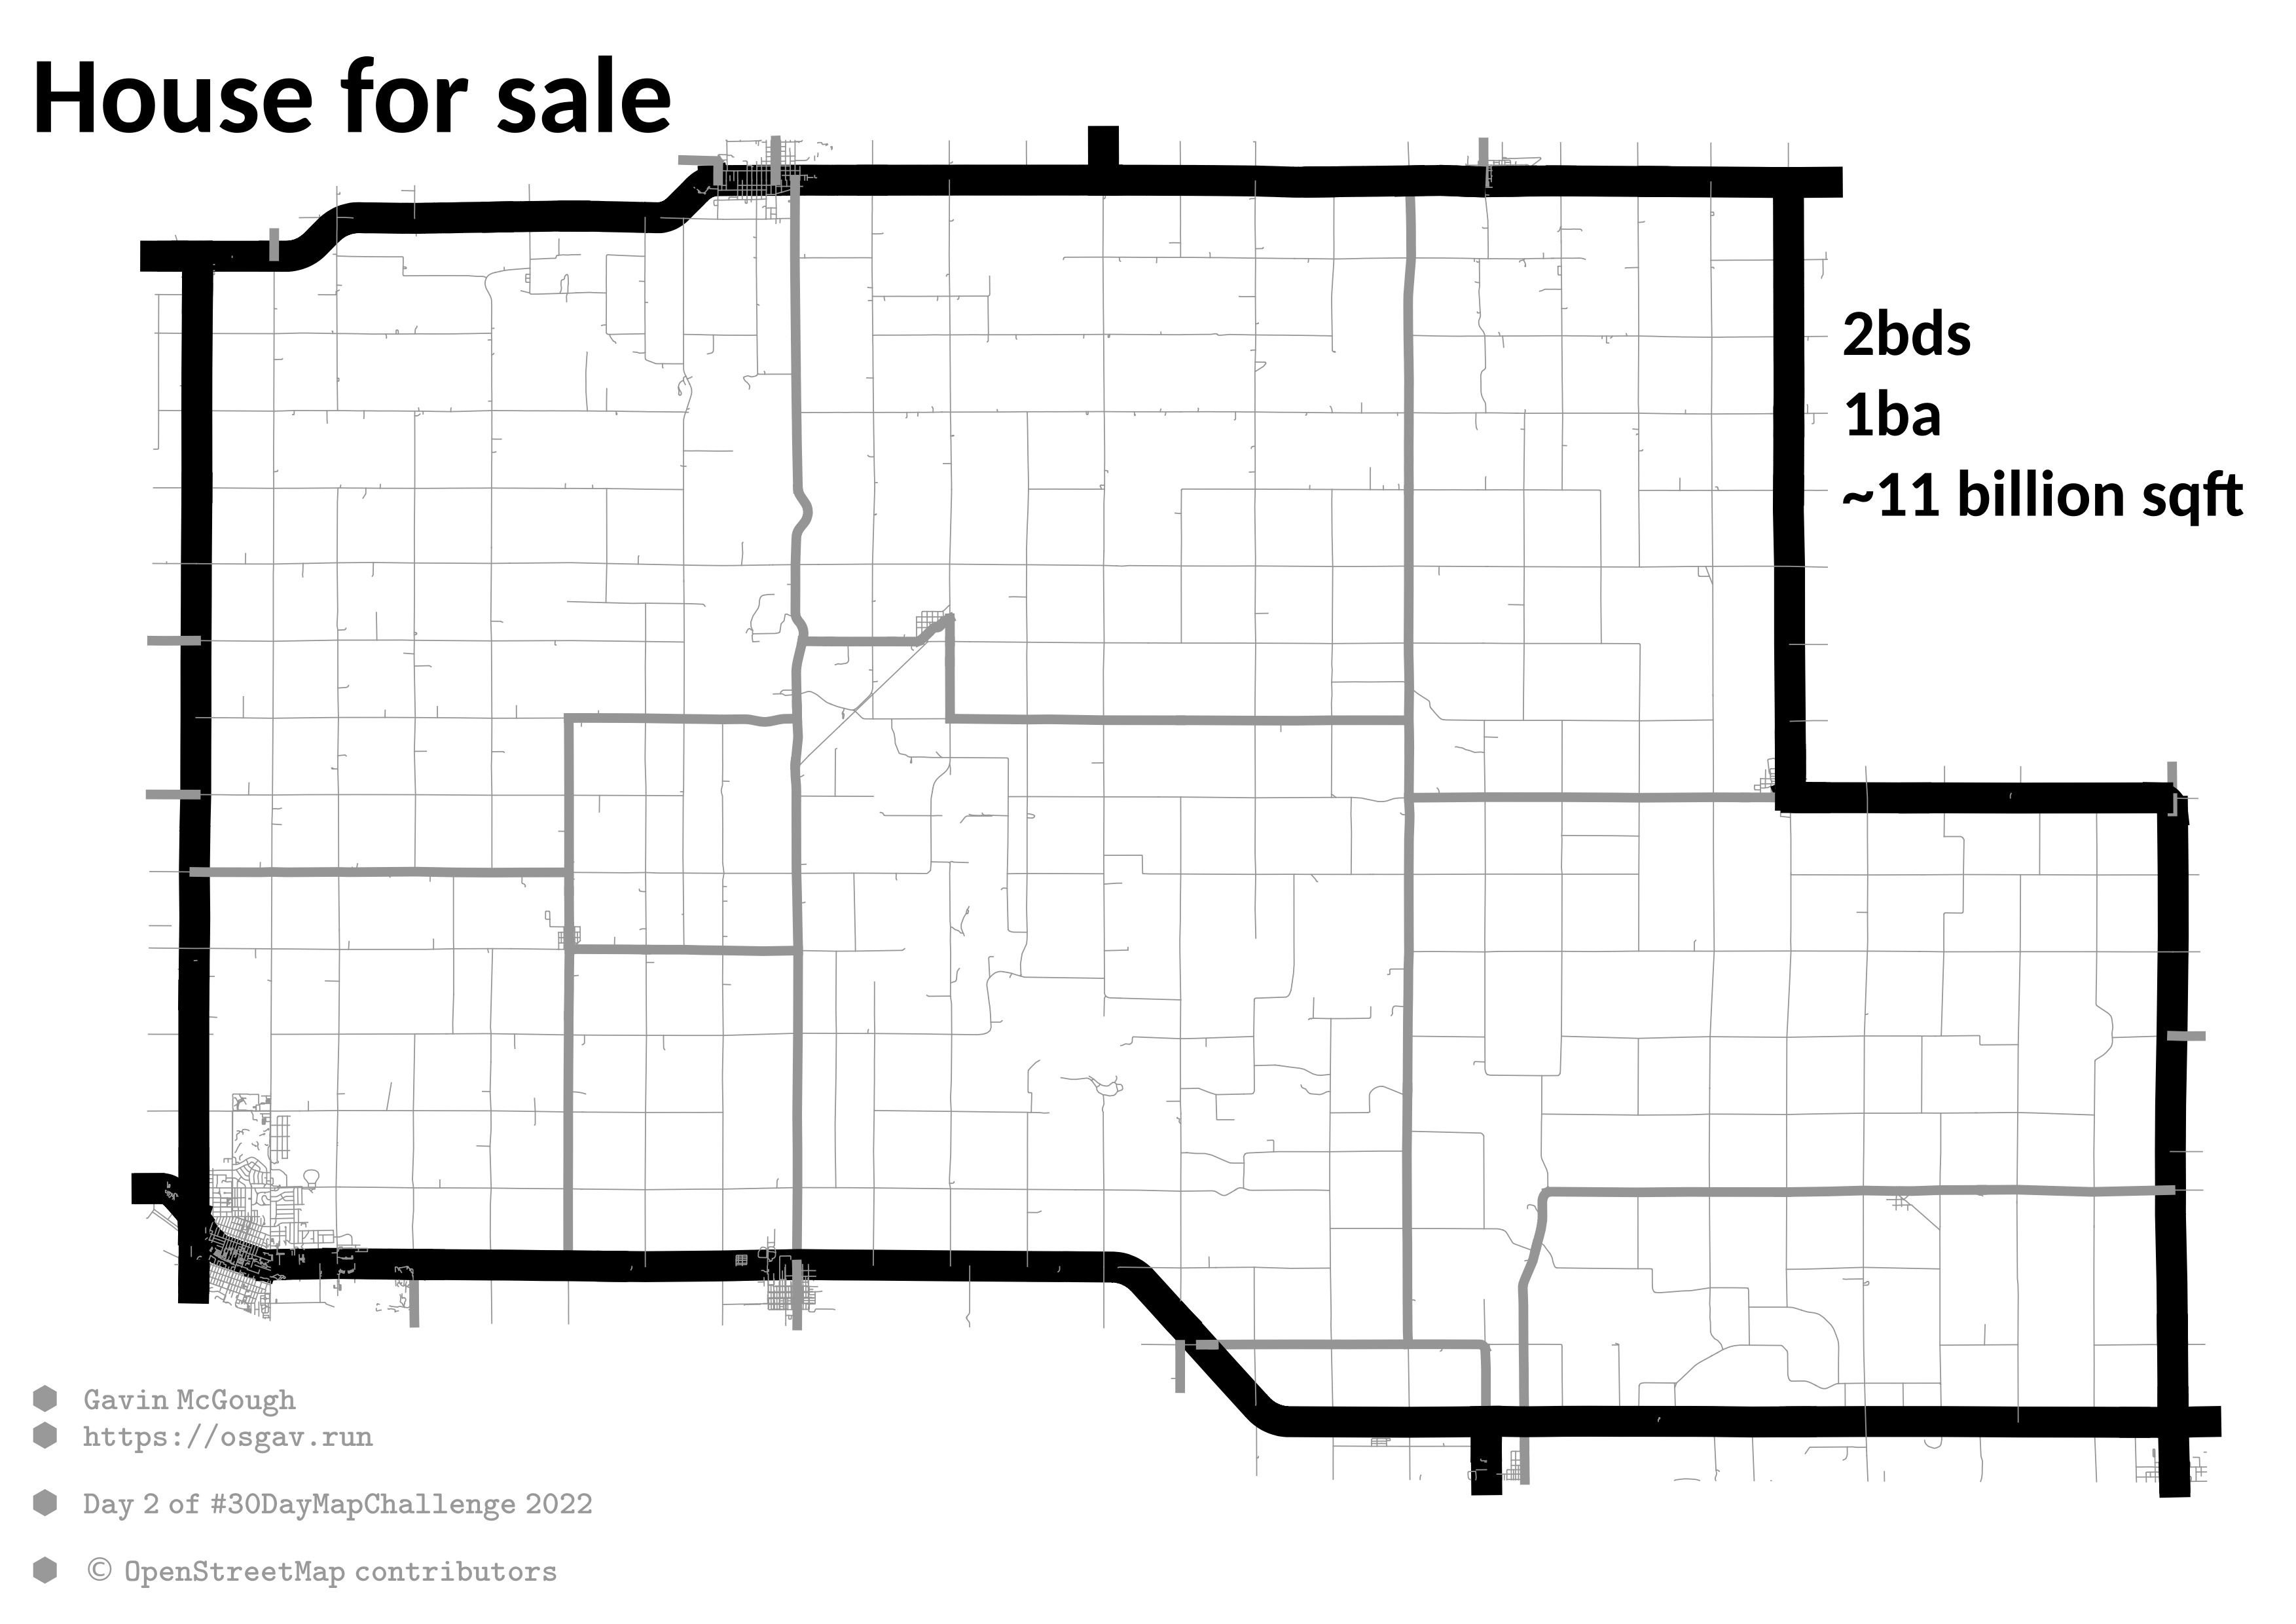
Data: © OpenStreetMap contributors
Tools: QGIS, OSMDownloader plugin
Techniques: categorized symbol based on highway field (primary, secondary, all others)
Social Media: view on Twitter or Mastodon
Bounding Boxes #

Data: Natural Earth
Tools: QGIS, Globe Builder plugin
Techniques: Vector geometry > Bounding boxes on Natural Earth Admin 1 polygons, played with Layer Rendering Blending Modes on both layers and features
Inspiration: Jason Davies https://www.jasondavies.com/maps/bounds/ for the general idea, and Anita Graser / Gretchen Peterson https://locatepress.com/book/qmd2 page 87 for Halo / Hemisphere styling
Social Media: view on Twitter or Mastodon
Access Granted #
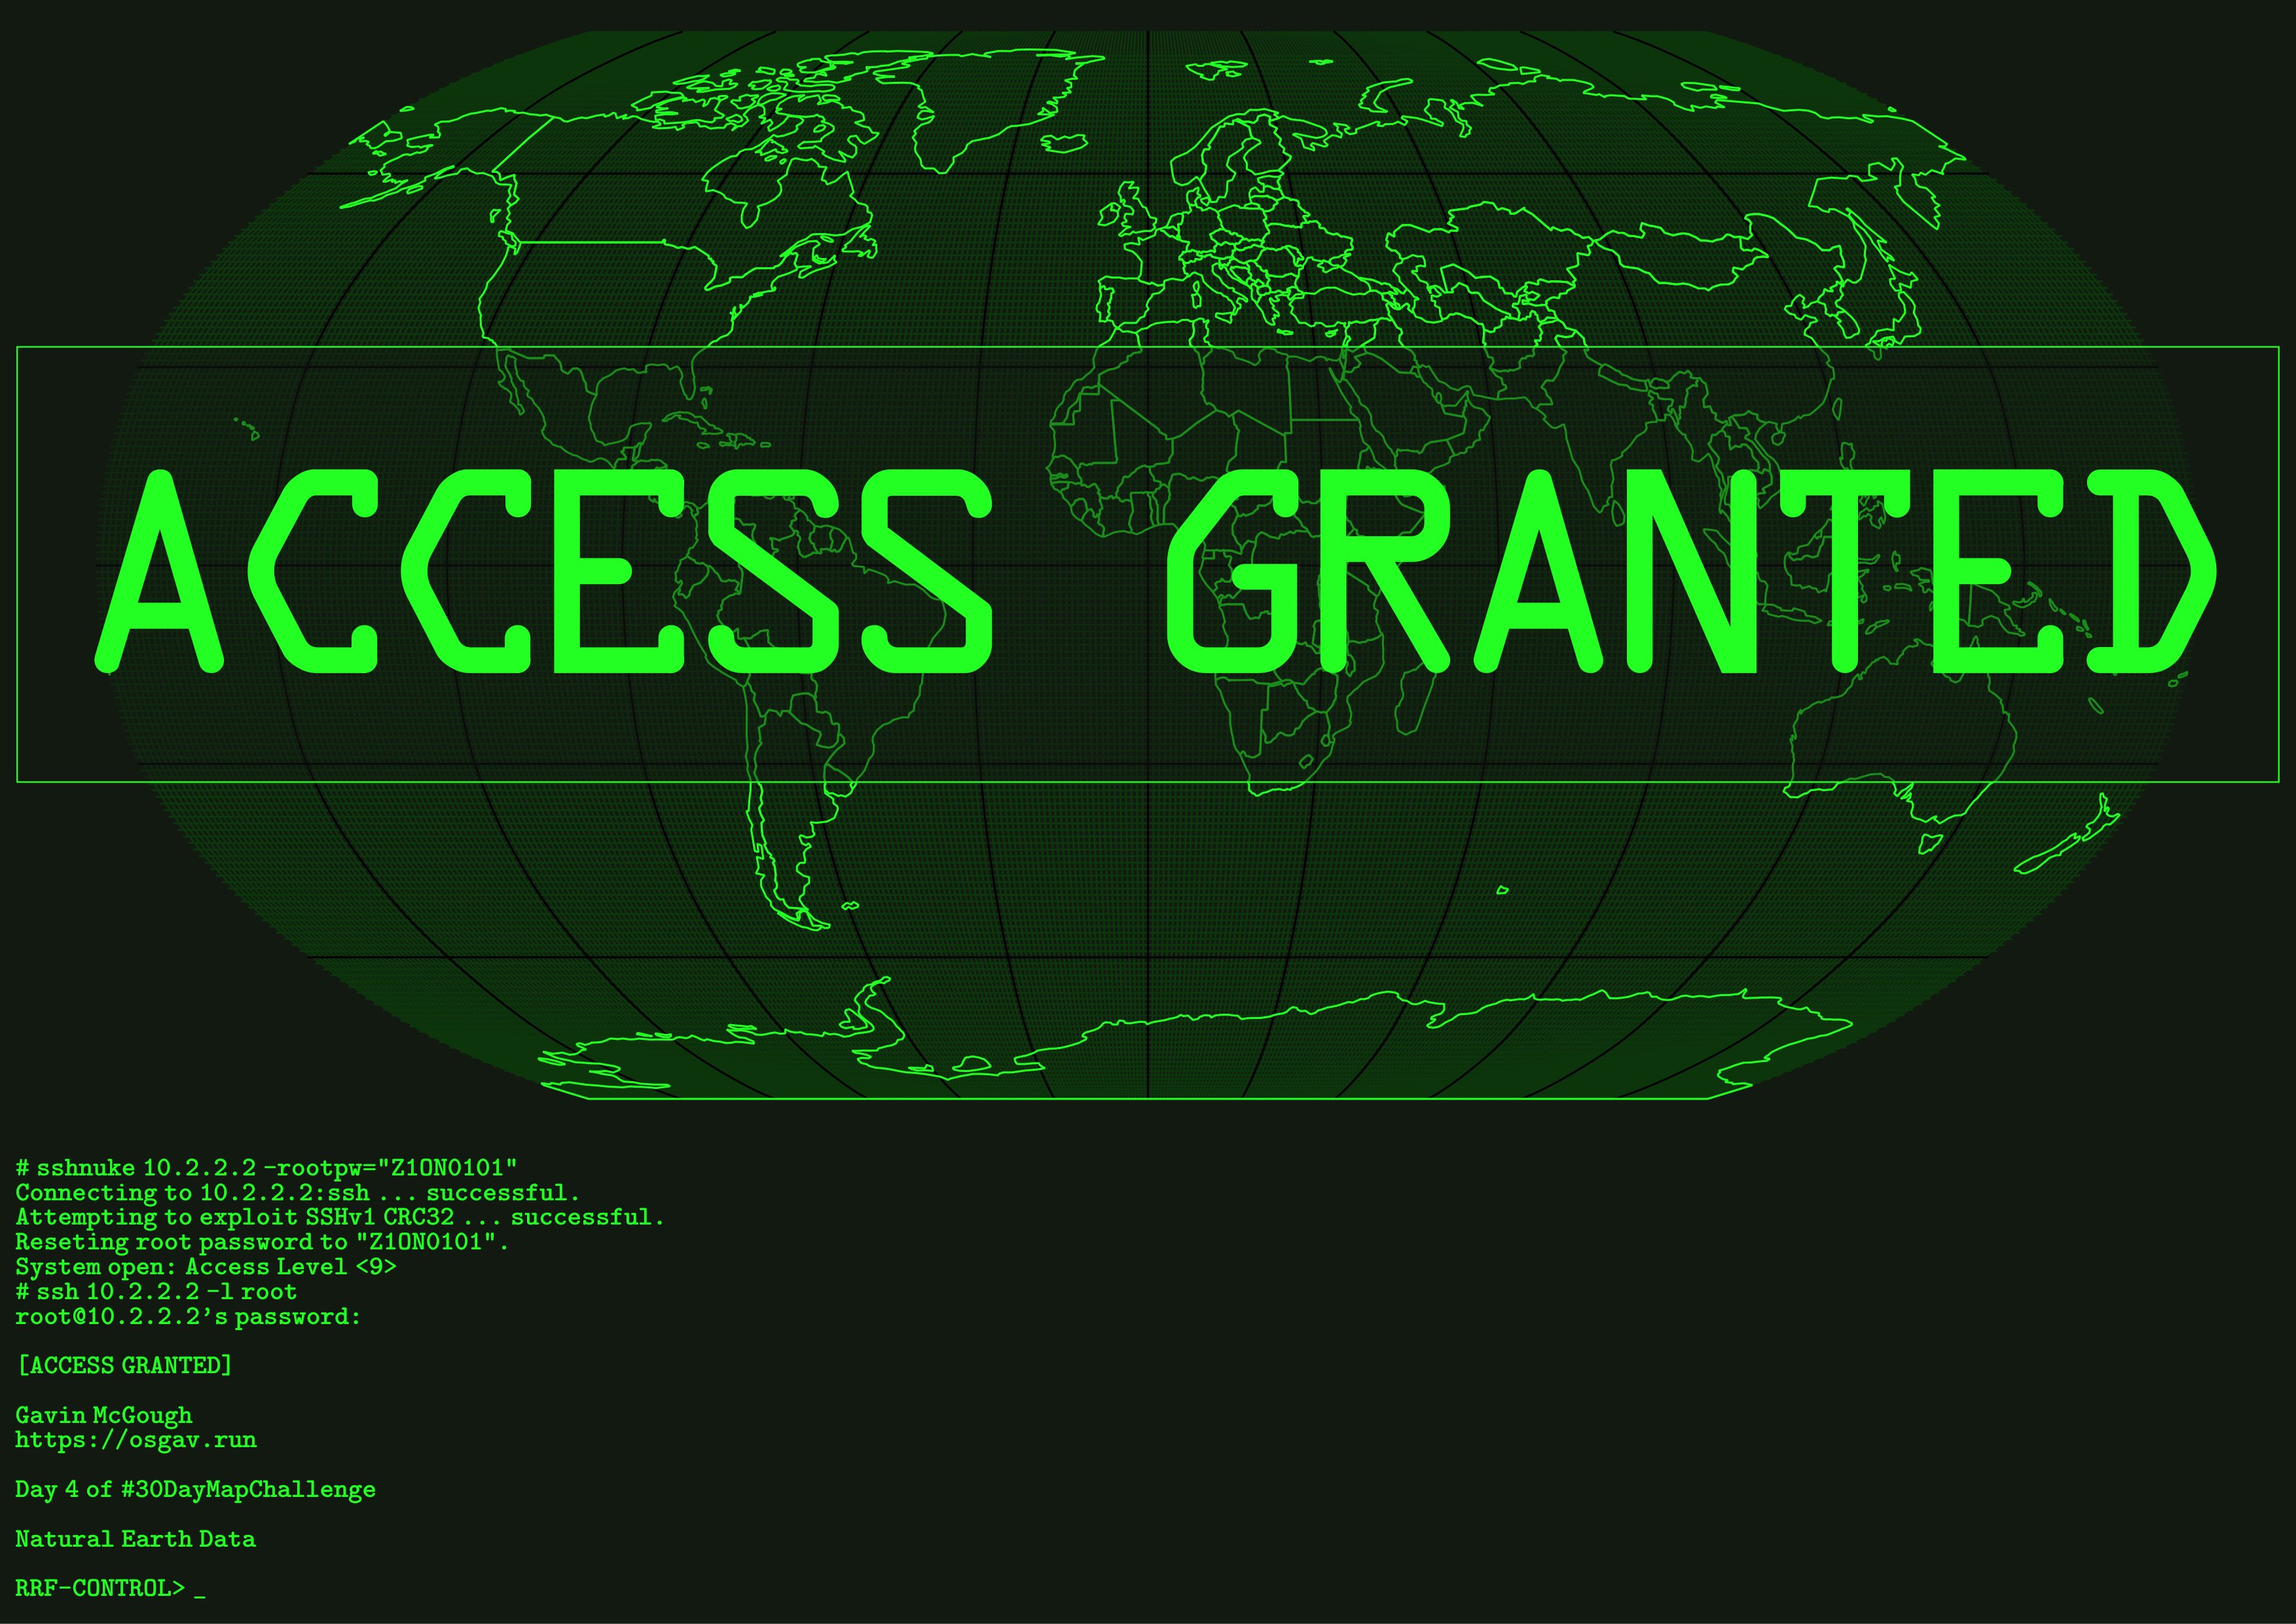
Data: Natural Earth
Tools: QGIS
Related Links: https://yewtu.be/watch?v=0PxTAn4g20U
Social Media: view on Twitter or Mastodon
Scotland #

Data: Scottish Government, specifically this dataset
Tools: QGIS
Techniques: playing around with IDW Interpolation on the altitude field
Social Media: view on Twitter or Mastodon
Amsterdam #
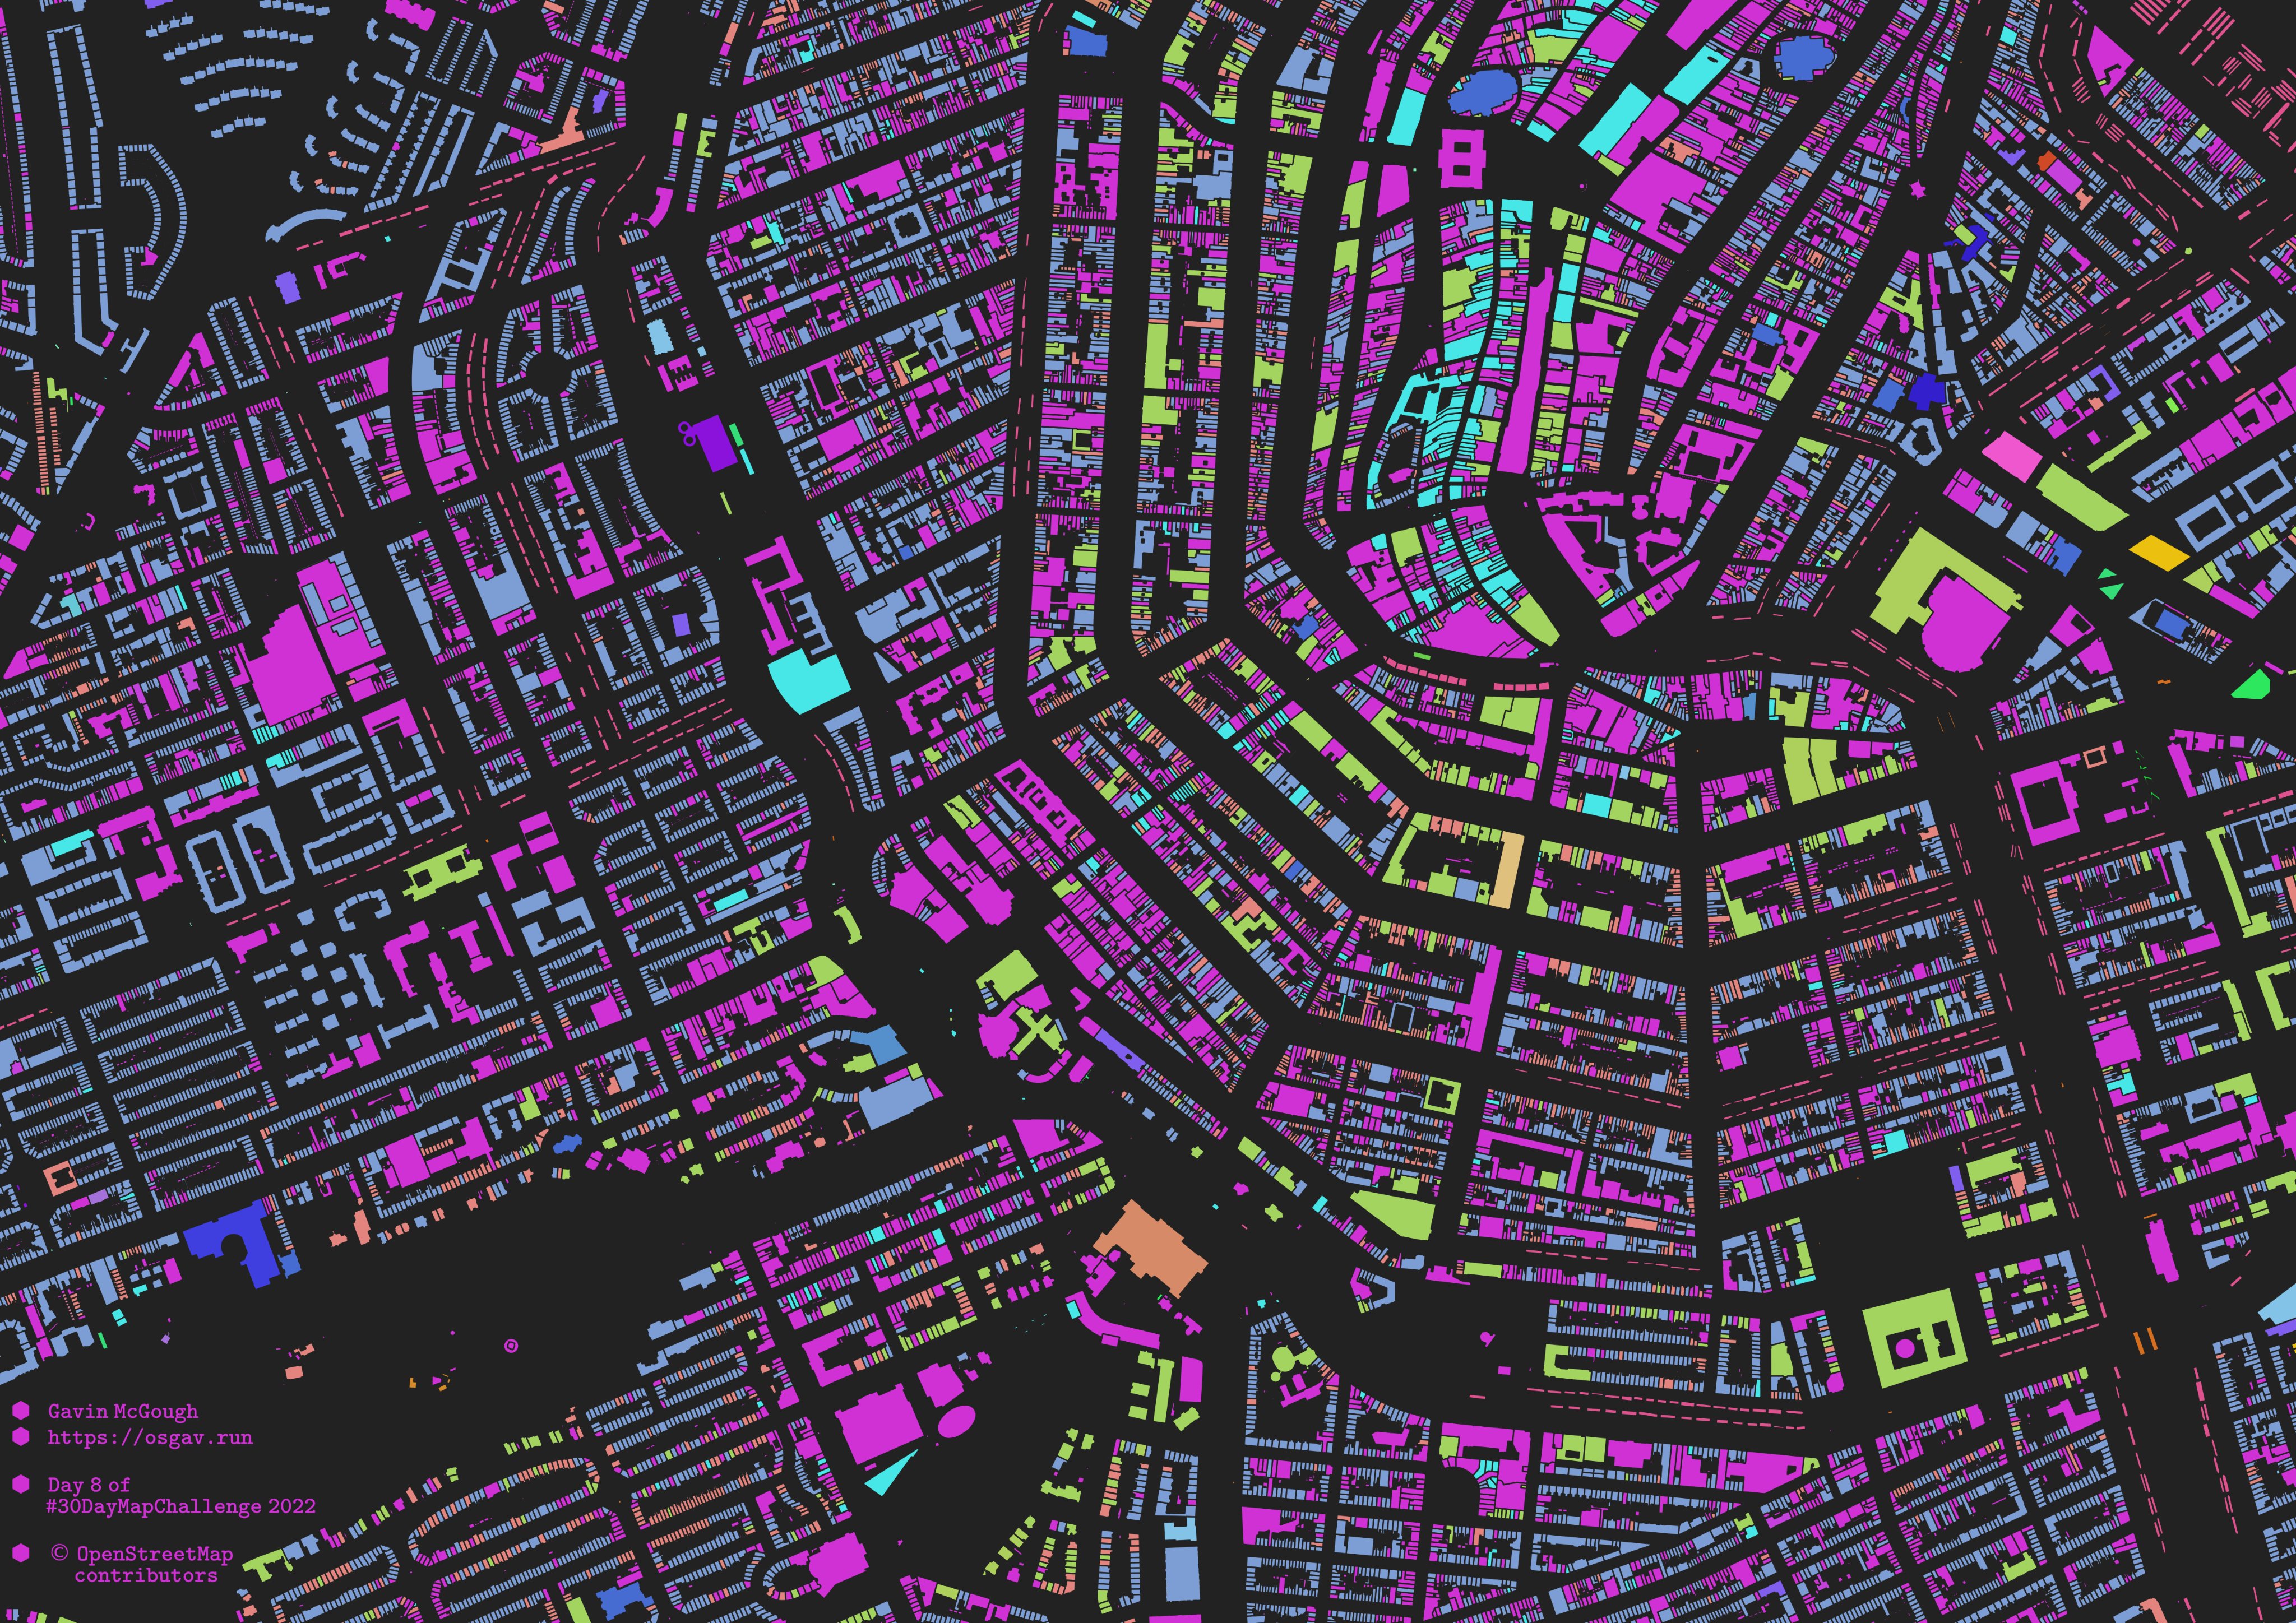
Data: © OpenStreetMap contributors
Tools: QGIS, QuickOSM plugin
Techniques: hitting Shuffle Random Colours until I liked what I saw
Inspiration: I had been looking at the links below and wanted a colour palette along those lines
Related Links: https://lexica.art/?q=cyberpunk and https://lexica.art/?q=neuromancer
Social Media: view on Twitter or Mastodon
UFO sightings in Ukraine #
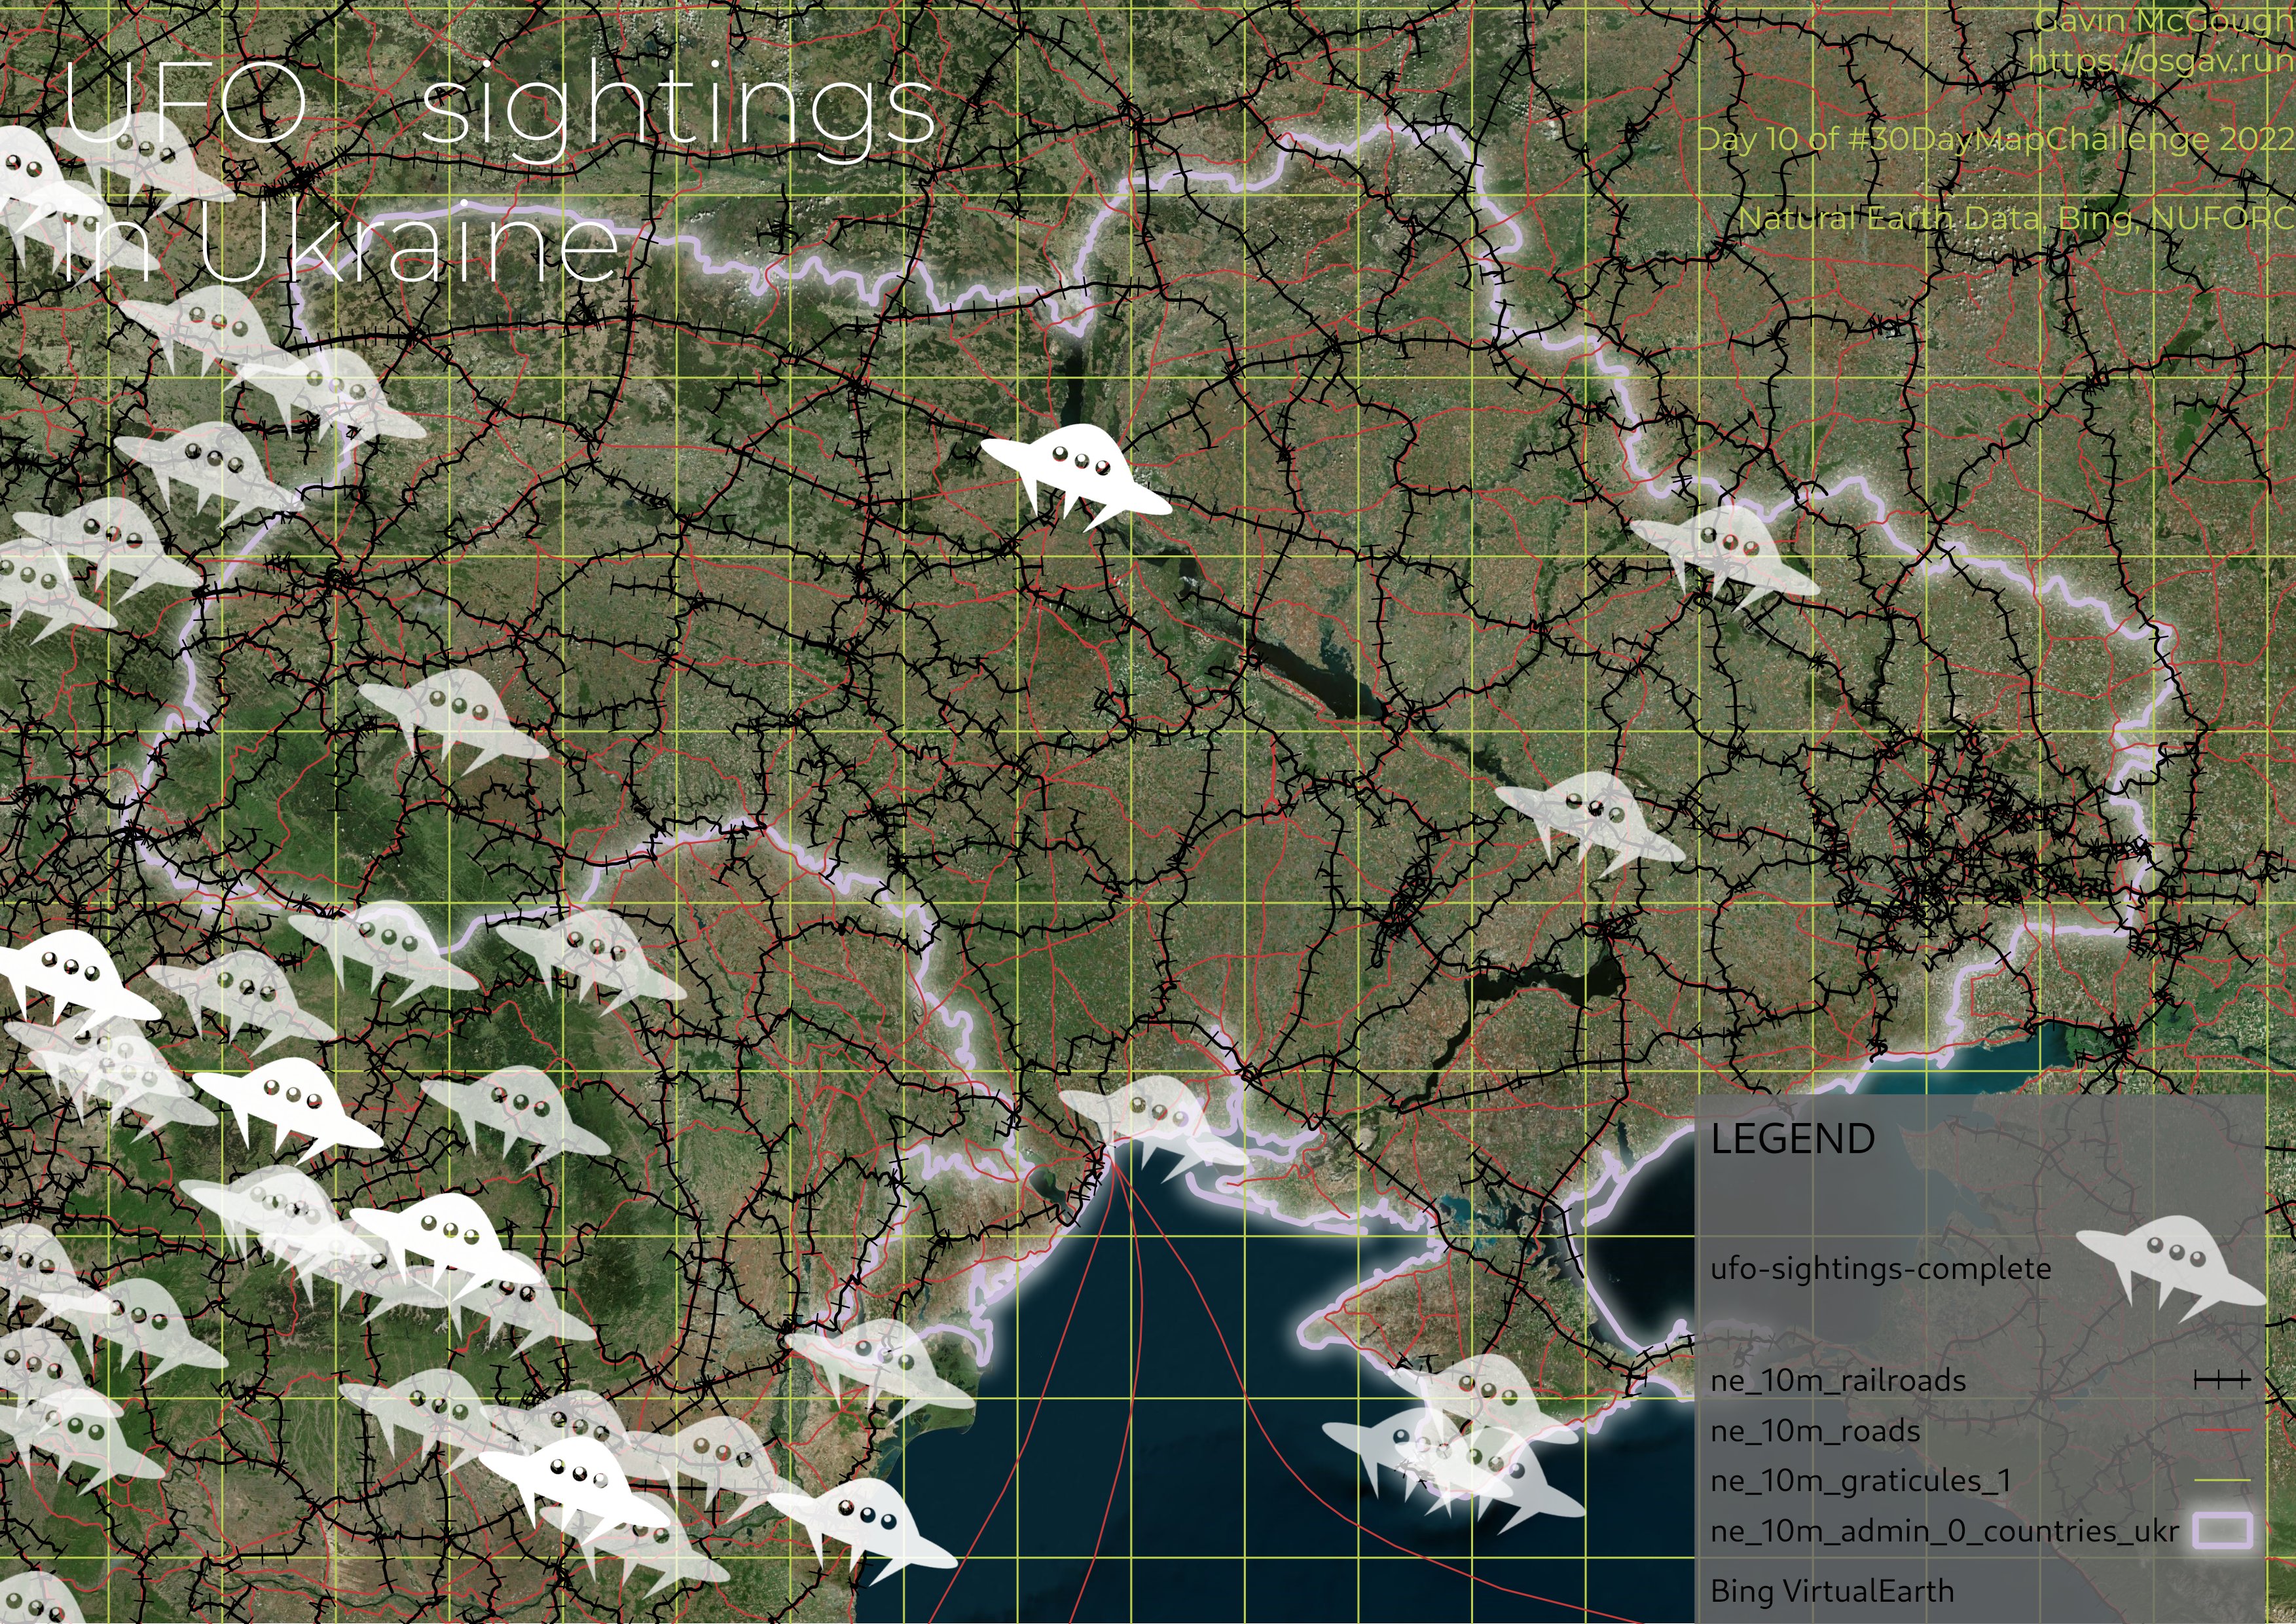
Data: Natural Earth, Bing VirtualEarth, NUFORC
Tools: QGIS
Techniques: lol
Inspiration: UFO data via a map I saw the day before
Nota bene: this was my map for Day 10: A bad map. I decided to blend together maps I’d missed so far so it also includes Days 5, 6, and 9 (Ukraine, Network, and Space).
Social Media: view on Twitter or Mastodon
Alert #

Data: Natural Earth
Tools: QGIS
Inspiration: my Access Granted map for Day 4: Colour Friday: Green (I decided to give all the Colour Fridays a similar look)
Social Media: view on Twitter or Mastodon
Southern Portugal #
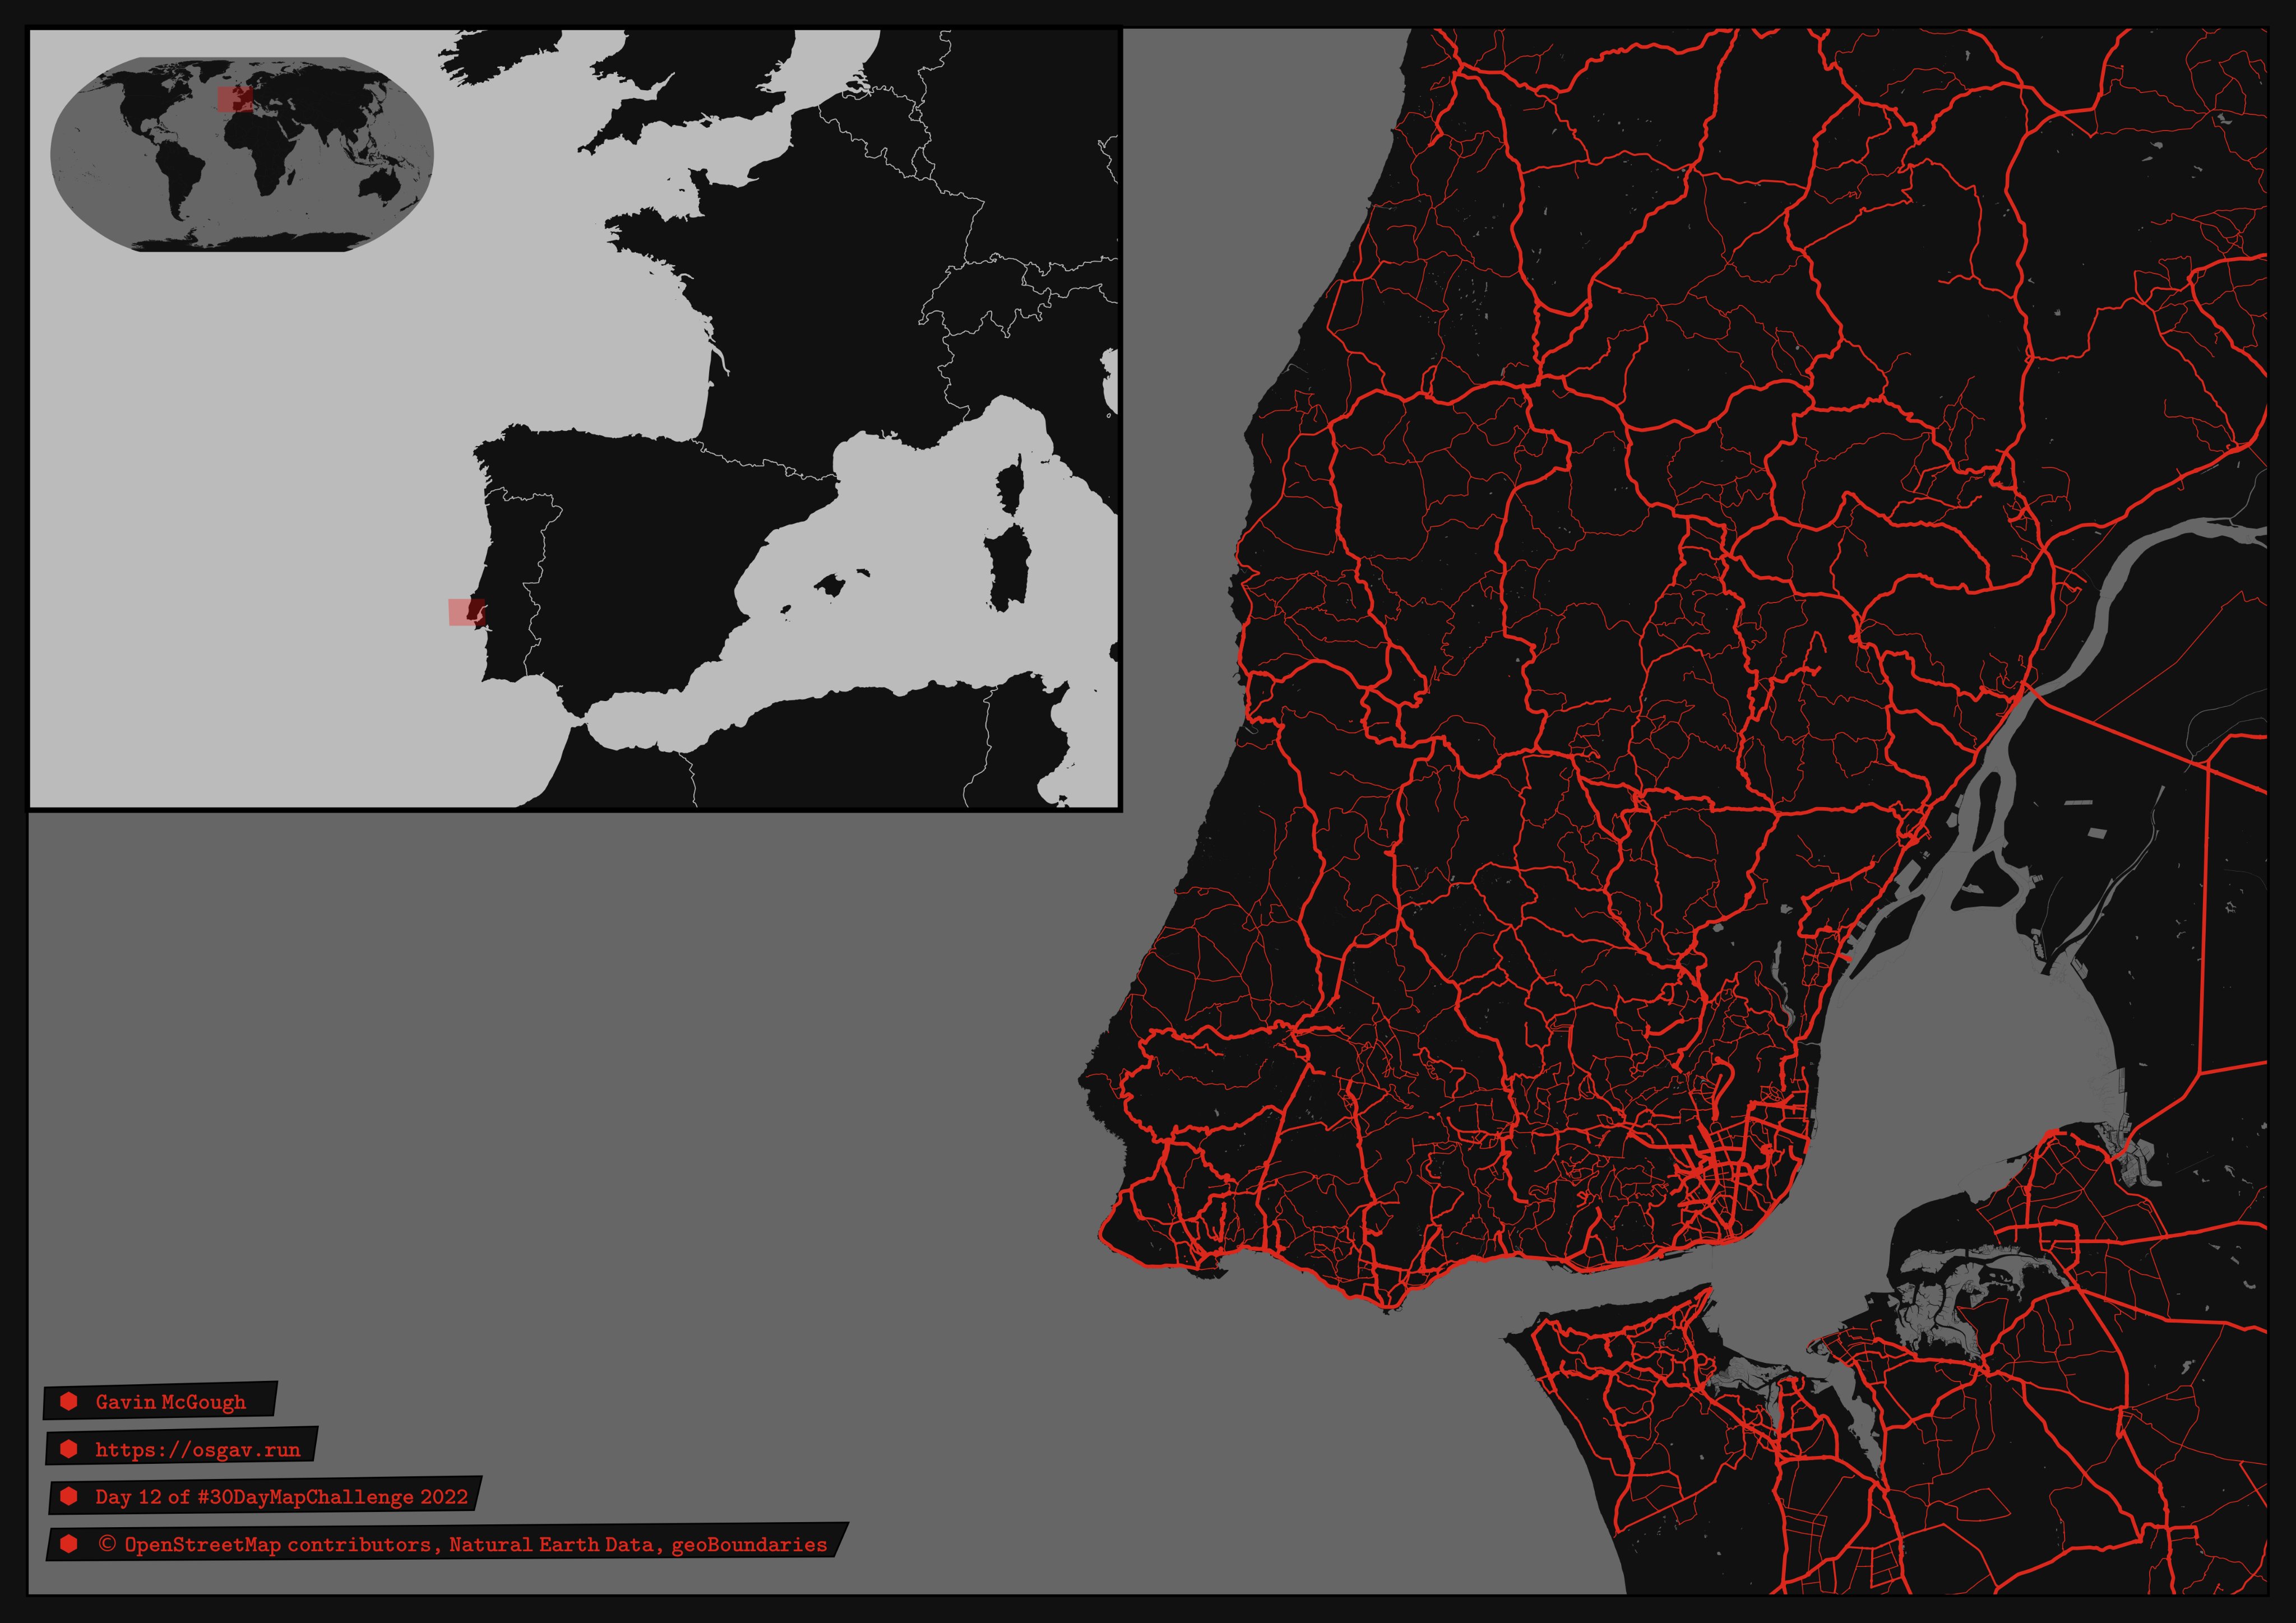
Data: © OpenStreetMap contributors, Natural Earth, geoBoundaries
Tools: QGIS
Techniques: Lock layers, Lock styles for layers, and Overviews
Social Media: view on Twitter or Mastodon
5 minutes in Lisbon #
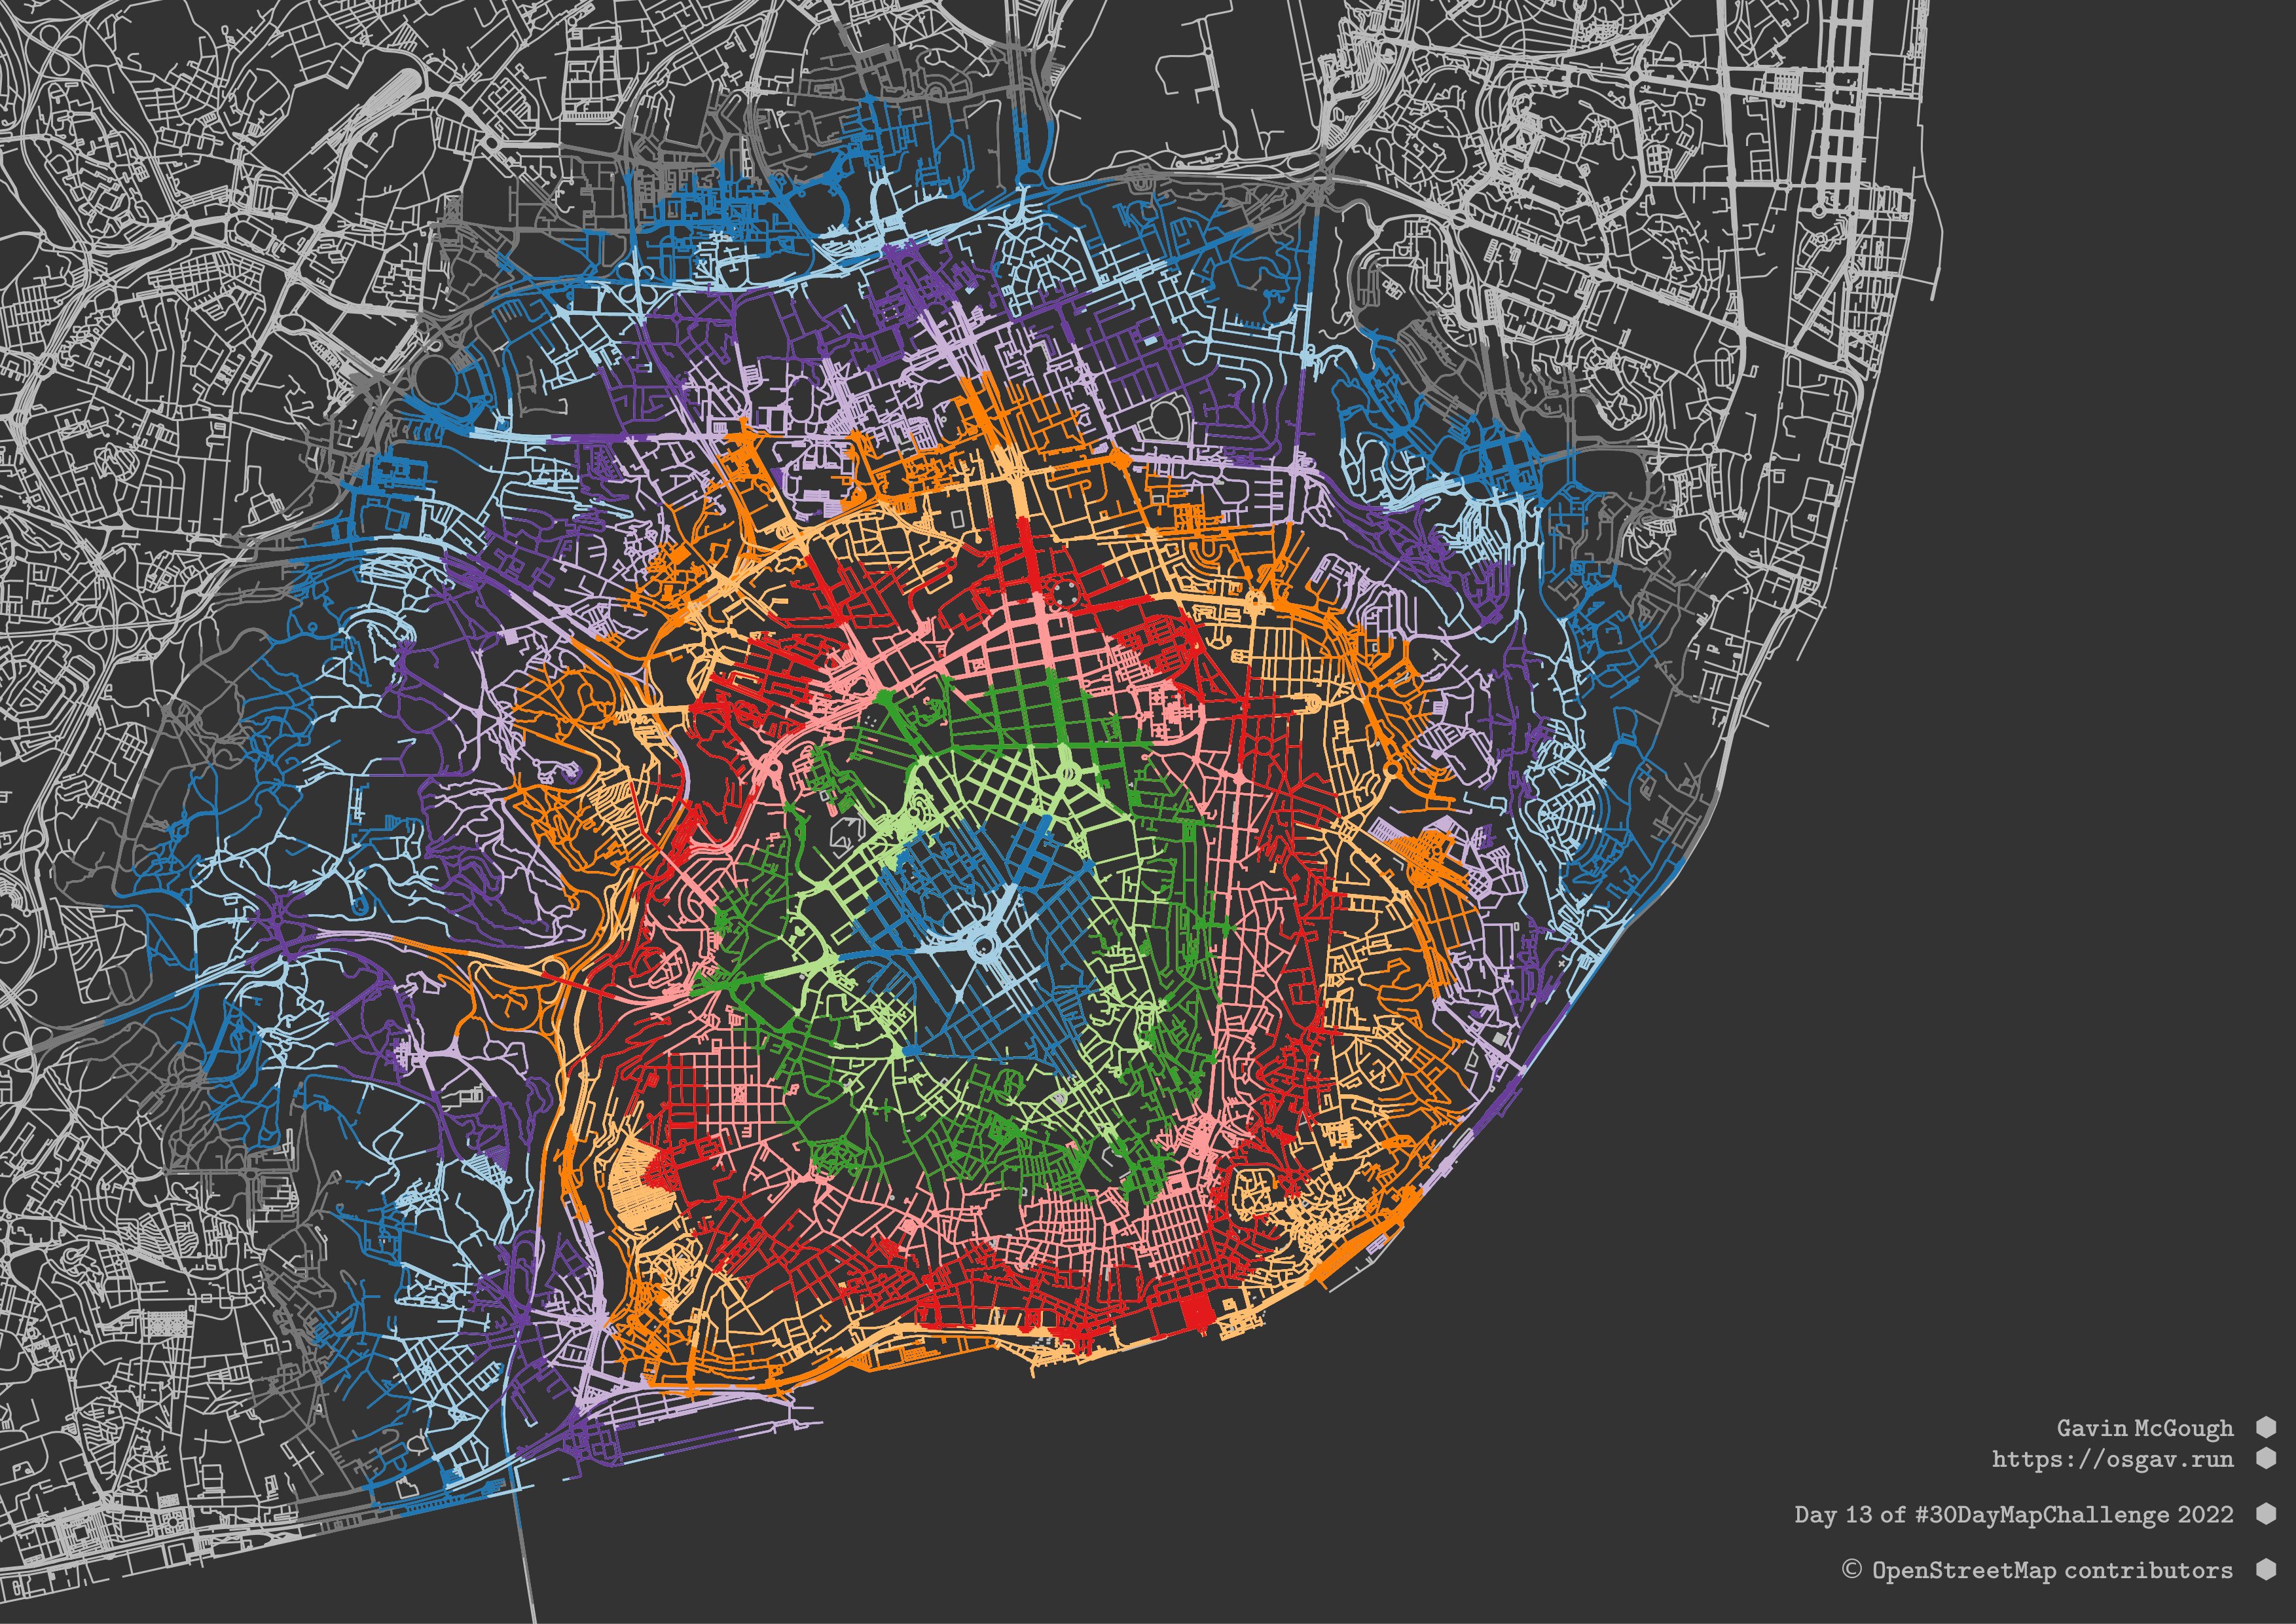
Data: © OpenStreetMap contributors
Tools: QGIS
Techniques: Network Analysis > Service area (from point), distance based using walking speed of 5km/h
Inspiration: the many isochrone maps I’d seen in the last year or so, decided to have a go at making one
Related Links: Cynthia Brewer https://colorbrewer2.org/#type=qualitative&scheme=Paired&n=10
Social Media: view on Twitter or Mastodon
Powerplant Density #
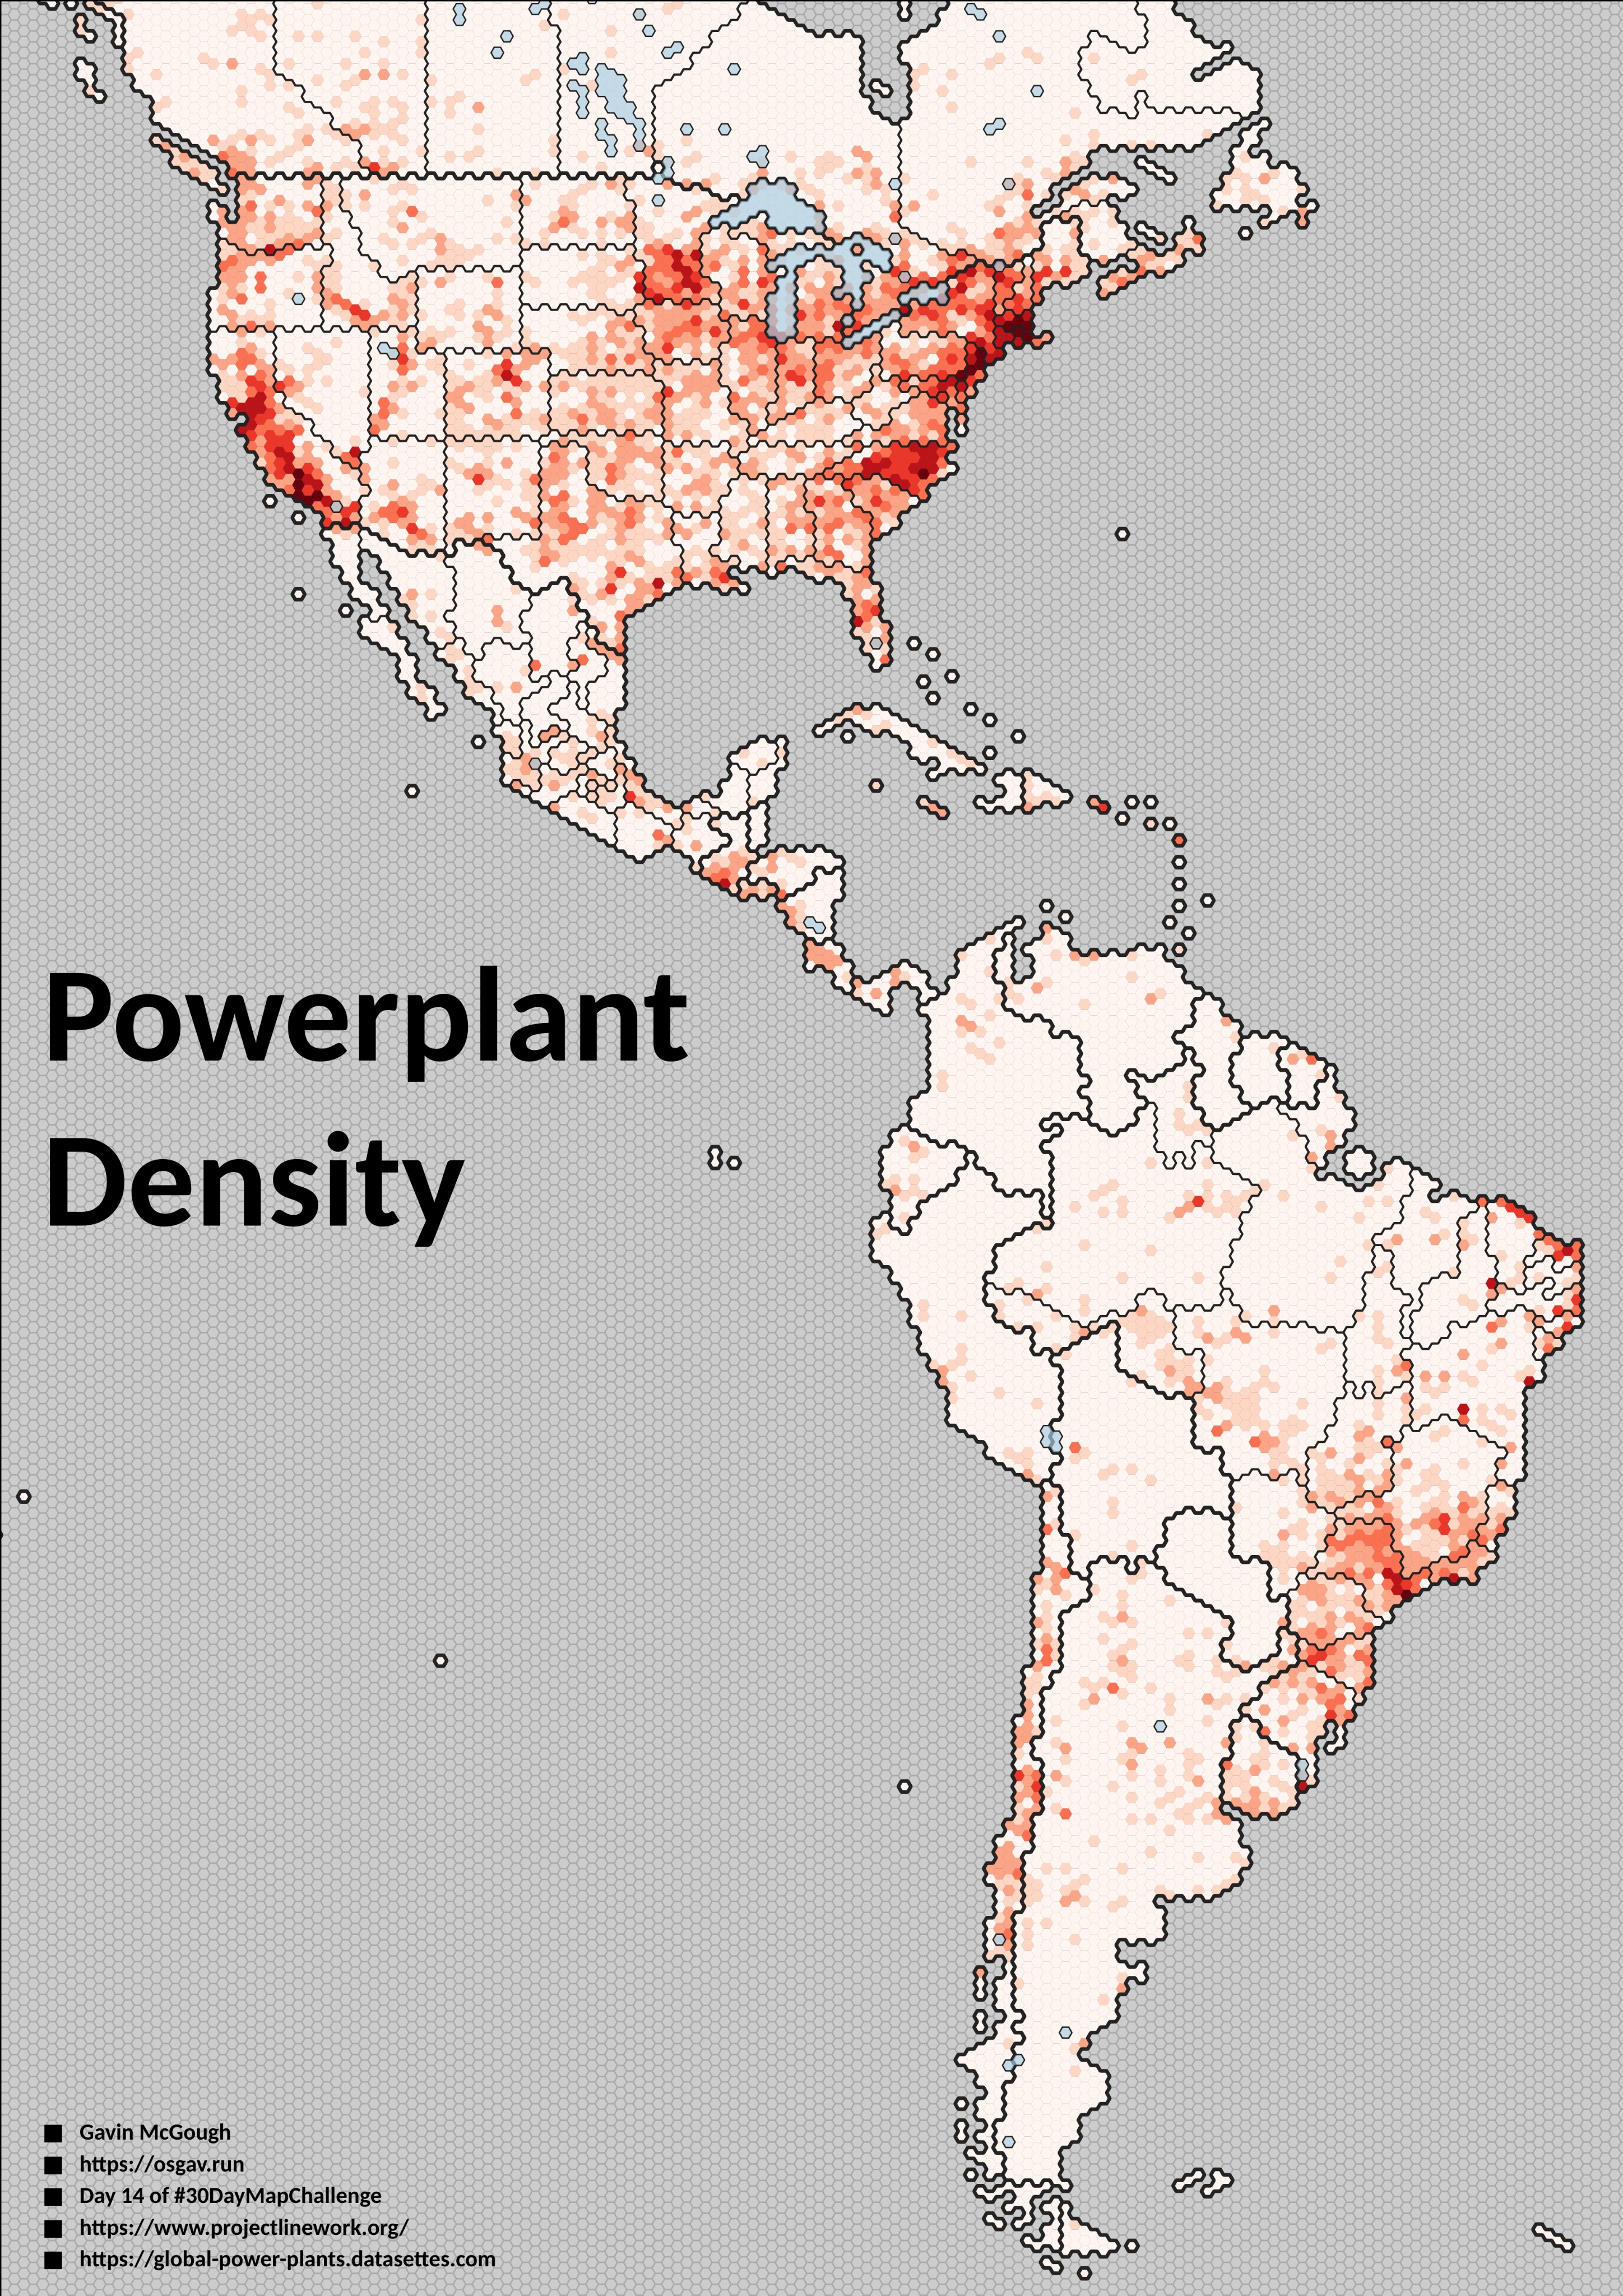
Data: Global Power Plants via Datasette, Project Linework
Tools: QGIS
Techniques: Vector Analysis > Count points in polygon
Related Links: https://freegistutorial.com/create-spatial-index-on-qgis/ (this sped things up considerably) and https://www.gislounge.com/using-qgis-create-hexbin-map-gisp-registrations/
Social Media: view on Twitter or Mastodon
World Port Index #
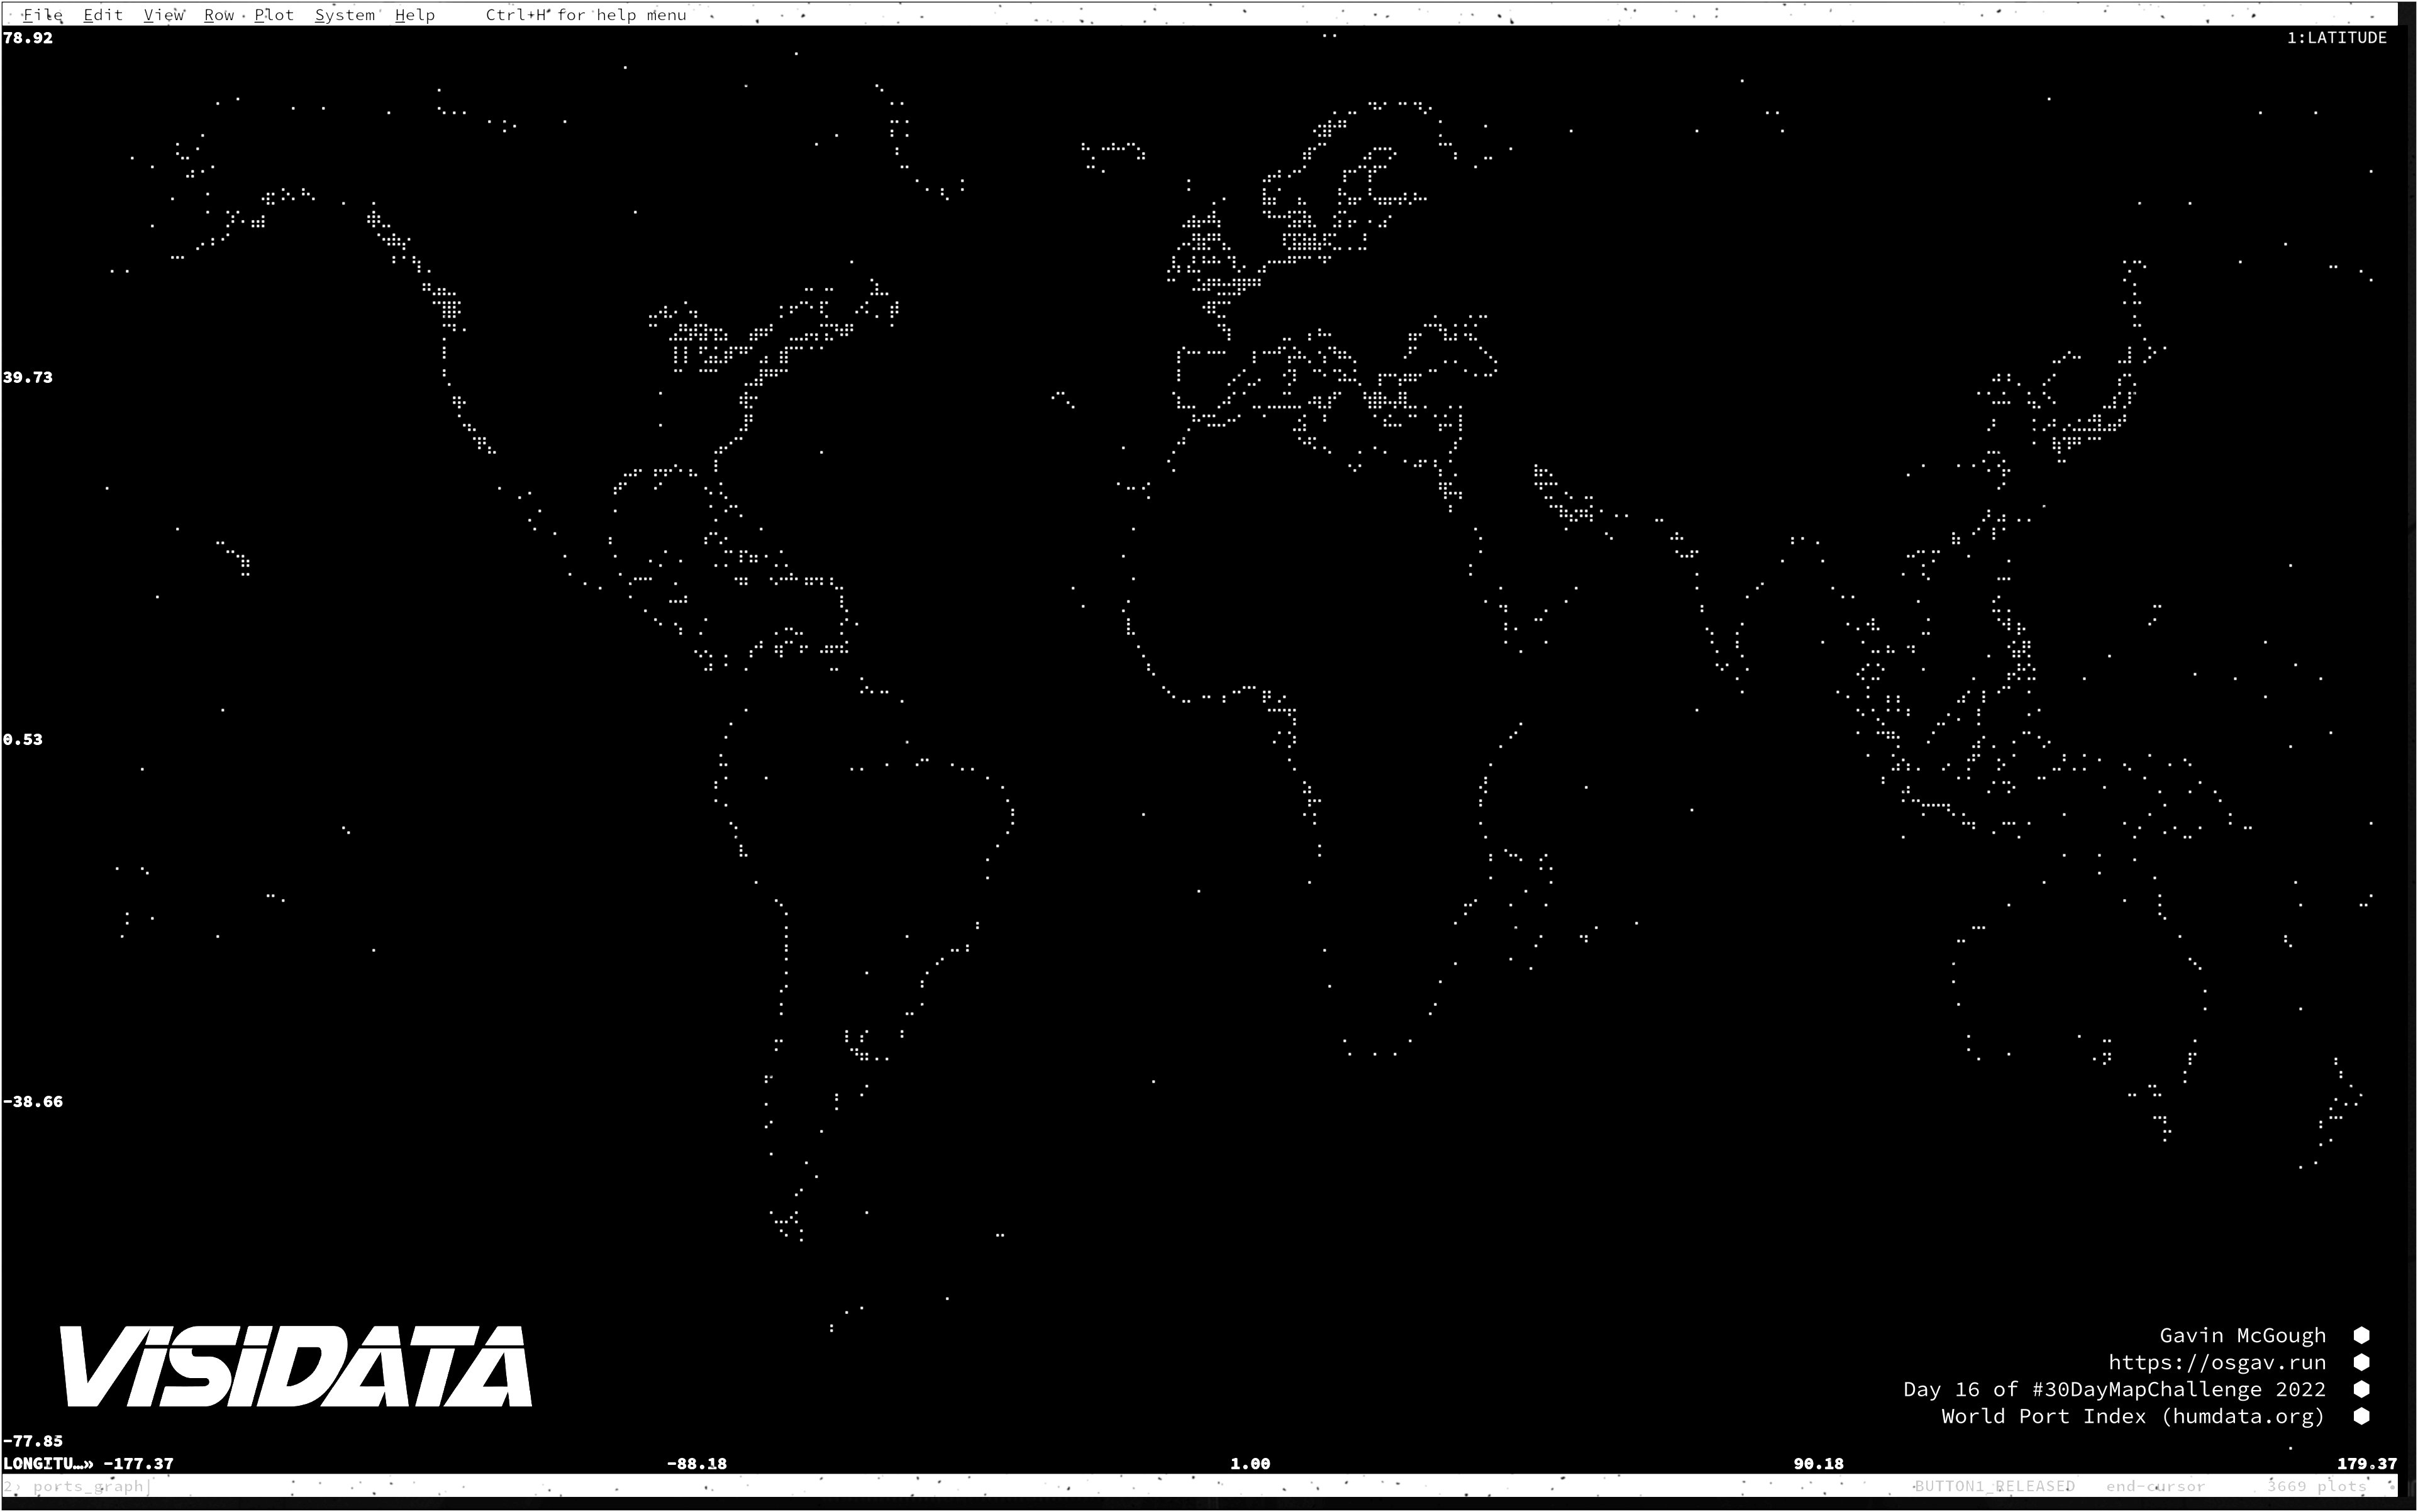
Data: World Port Index
Tools: VisiData, InkScape
Inspiration: the ability to make graphs per this demo
Related Links: https://www.visidata.org/docs/graph/
Social Media: view on Twitter or Mastodon
Rose Street Pub Crawl #
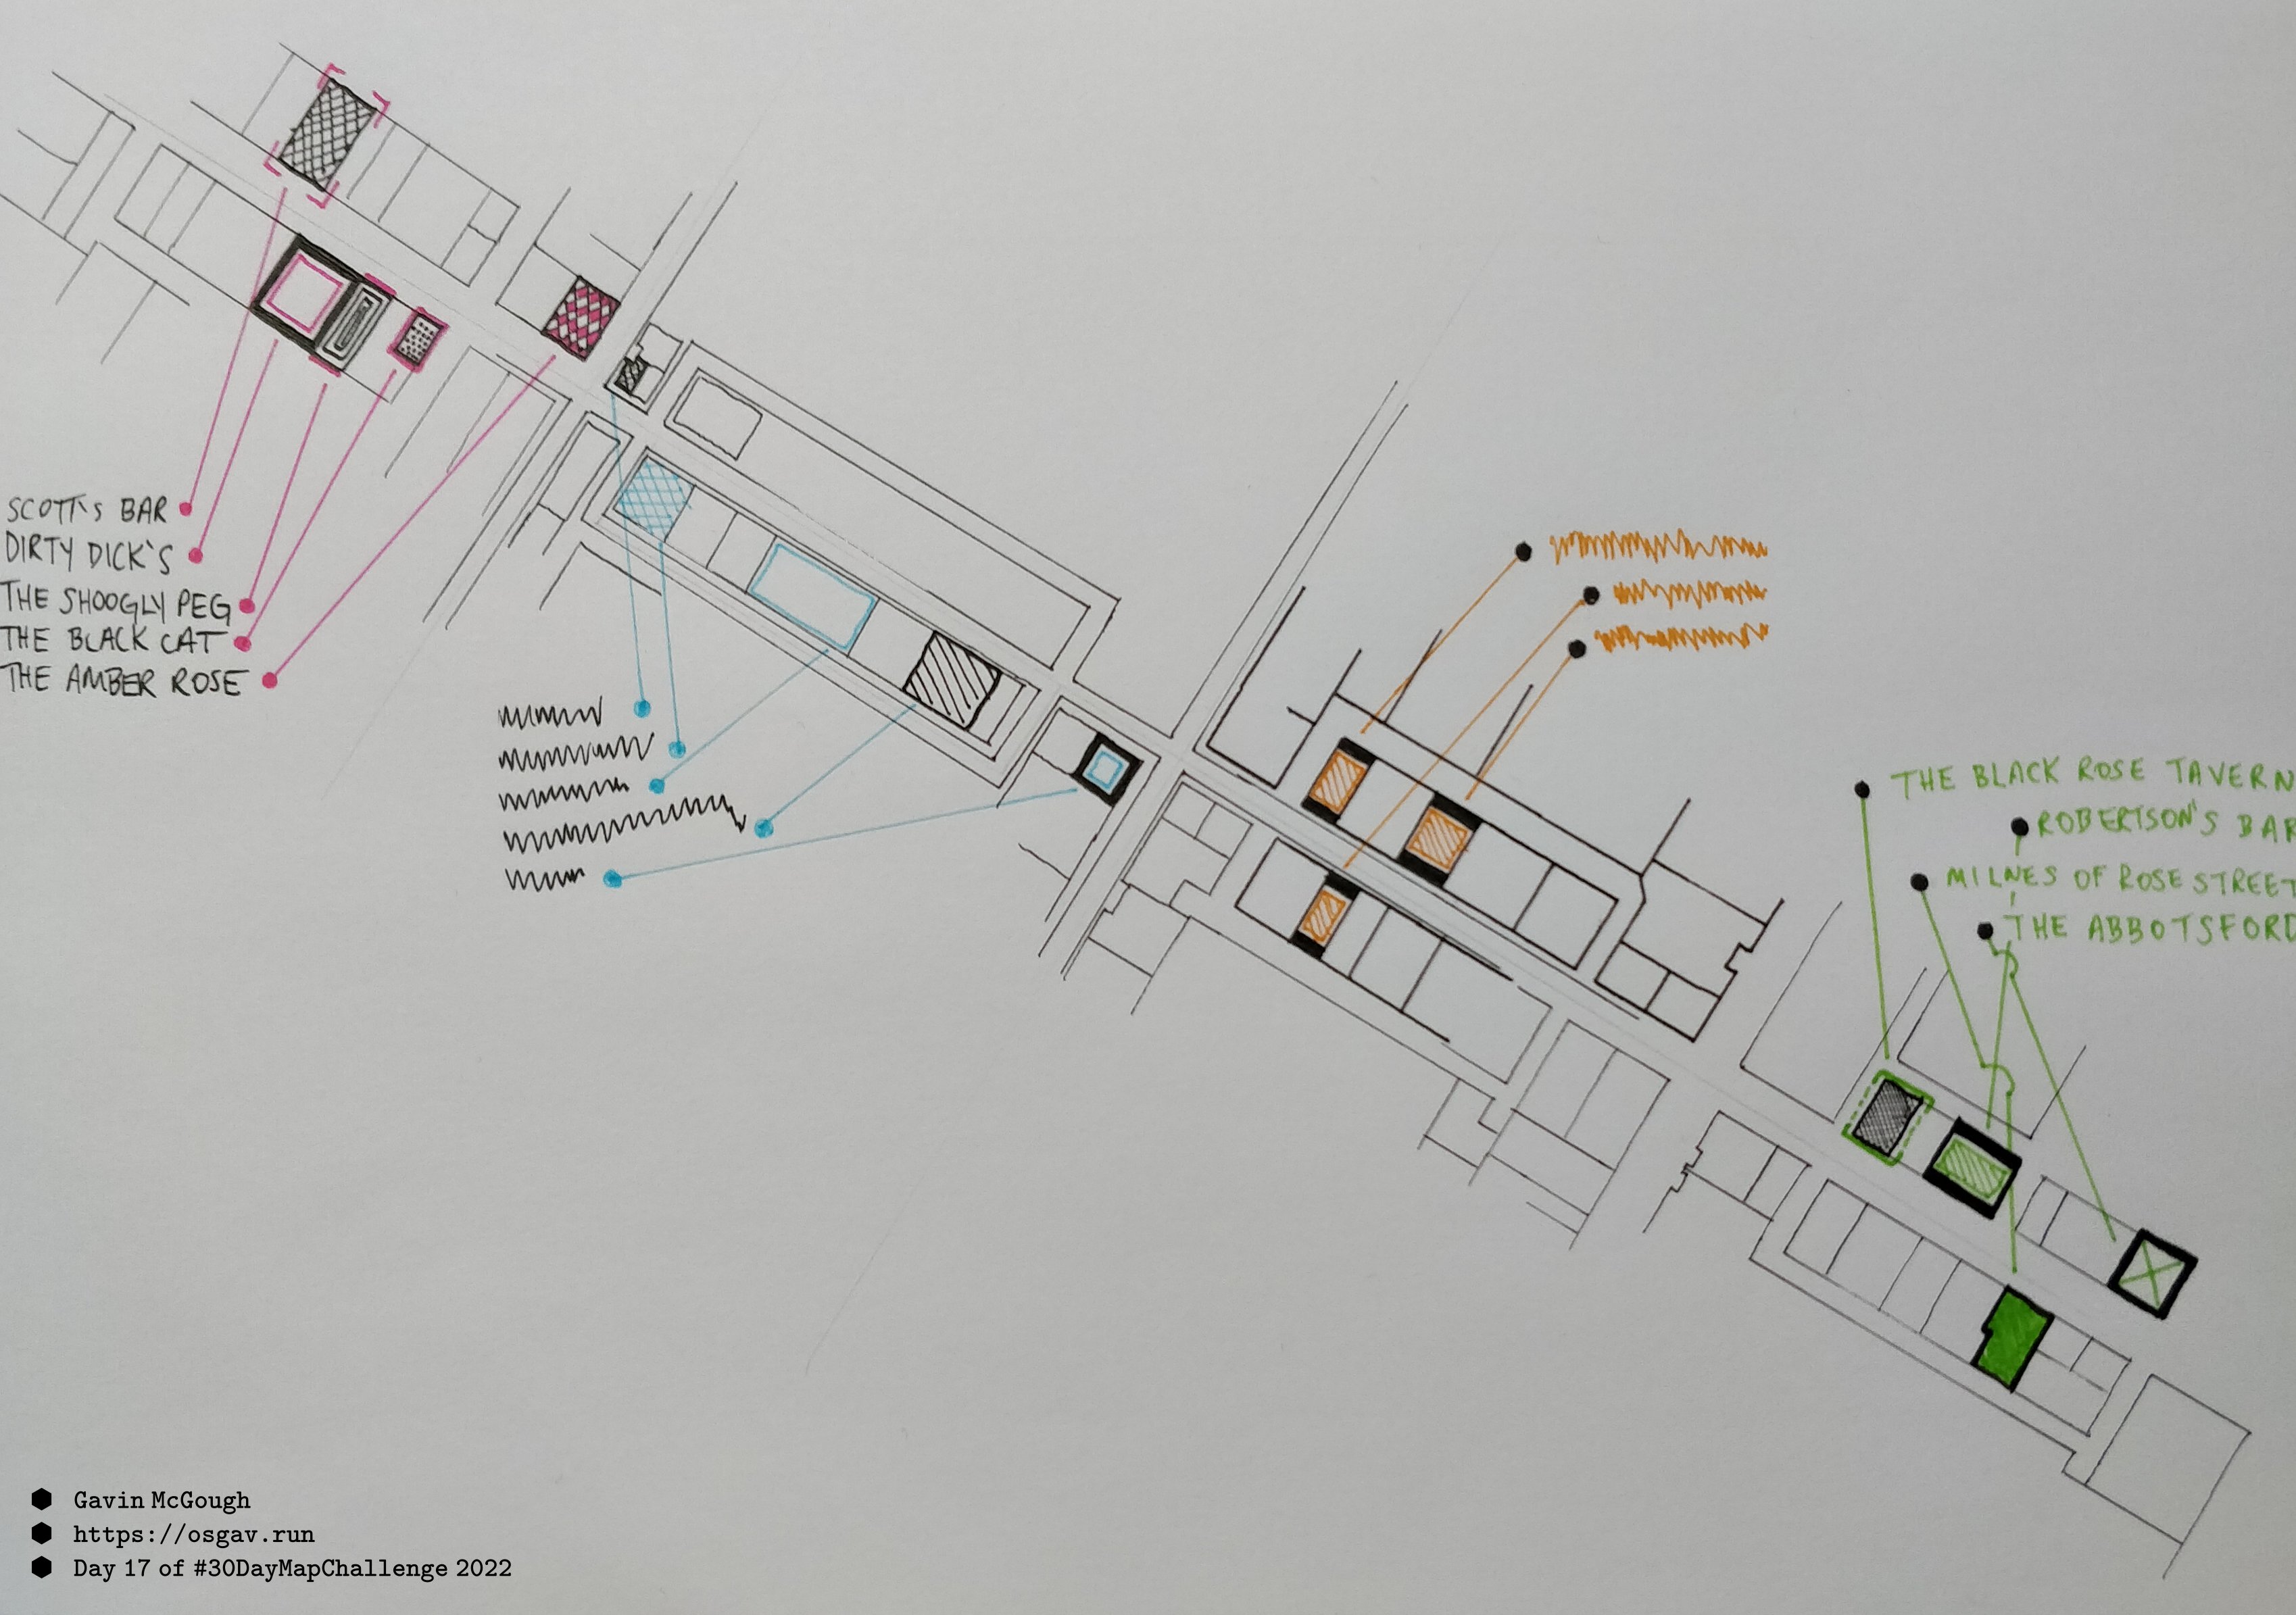
Data: © OpenStreetMap contributors, Google Maps
Tools: paper, pencil, ruler, pens
Techniques: a little bit of maths and then looking at the screen, then the paper, then back at the screen, then back at the paper…
Social Media: view on Twitter or Mastodon
Sonar Activated #

Data: Natural Earth
Tools: QGIS
Inspiration: my Access Granted and Alert maps for the previous Colour Fridays
Social Media: view on Twitter or Mastodon
The Information Superhighway #

Data: Natural Earth, TeleGeography (they shutdown this repo between last month and now it seems, their FAQ states they no longer maintain and update a repo on GitHub, so I guess https://www.submarinecablemap.com/ itself is the source for it now)
Tools: QGIS, Globe Builder plugin
Techniques: styled globe the same as Bounding Boxes from Day 4, styled cables using the colours provided by TeleGeography
Inspiration: submarine cable data via a map I saw earlier in the month
Social Media: view on Twitter or Mastodon
Zamboni #
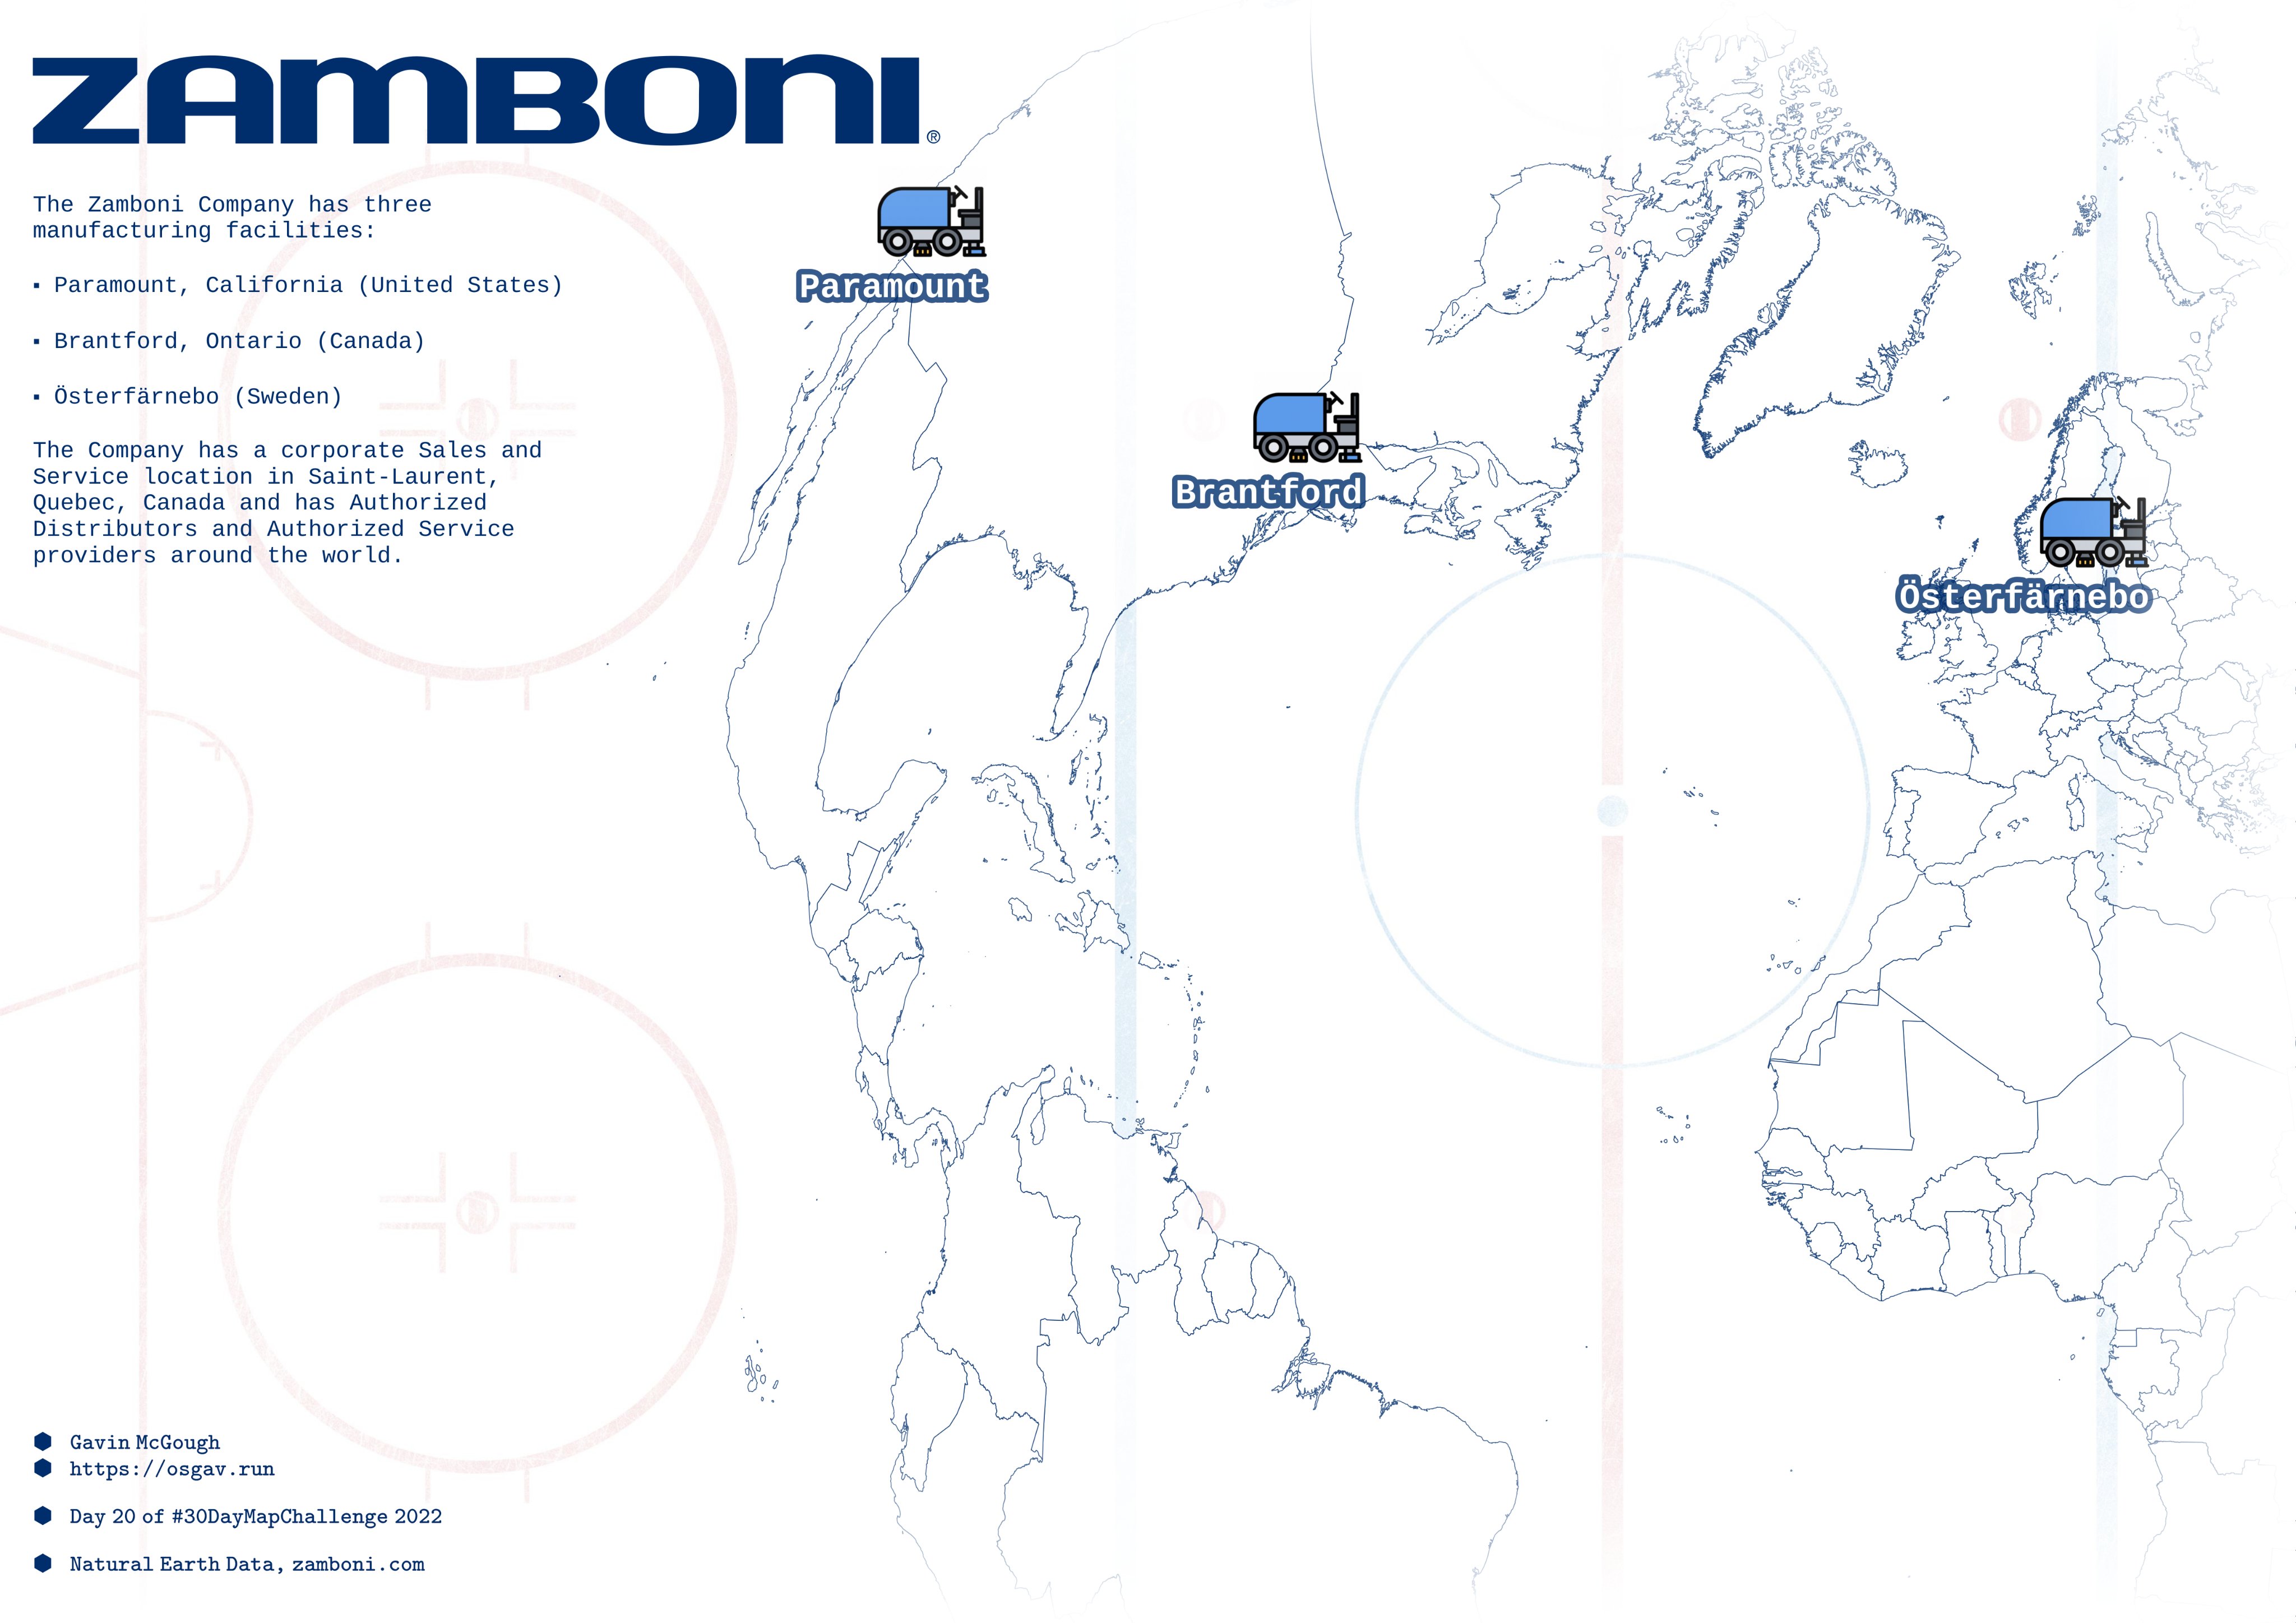
Data: Natural Earth, Zamboni
Tools: QGIS
Inspiration: some very artful maps from @MapsbyW earlier in the month inspired me to have a go at something different
Related Links: https://www.esri.com/arcgis-blog/products/mapping/mapping/steal-these-vignettes-please/
Social Media: view on Twitter or Mastodon
Manhattan Bus Routes #
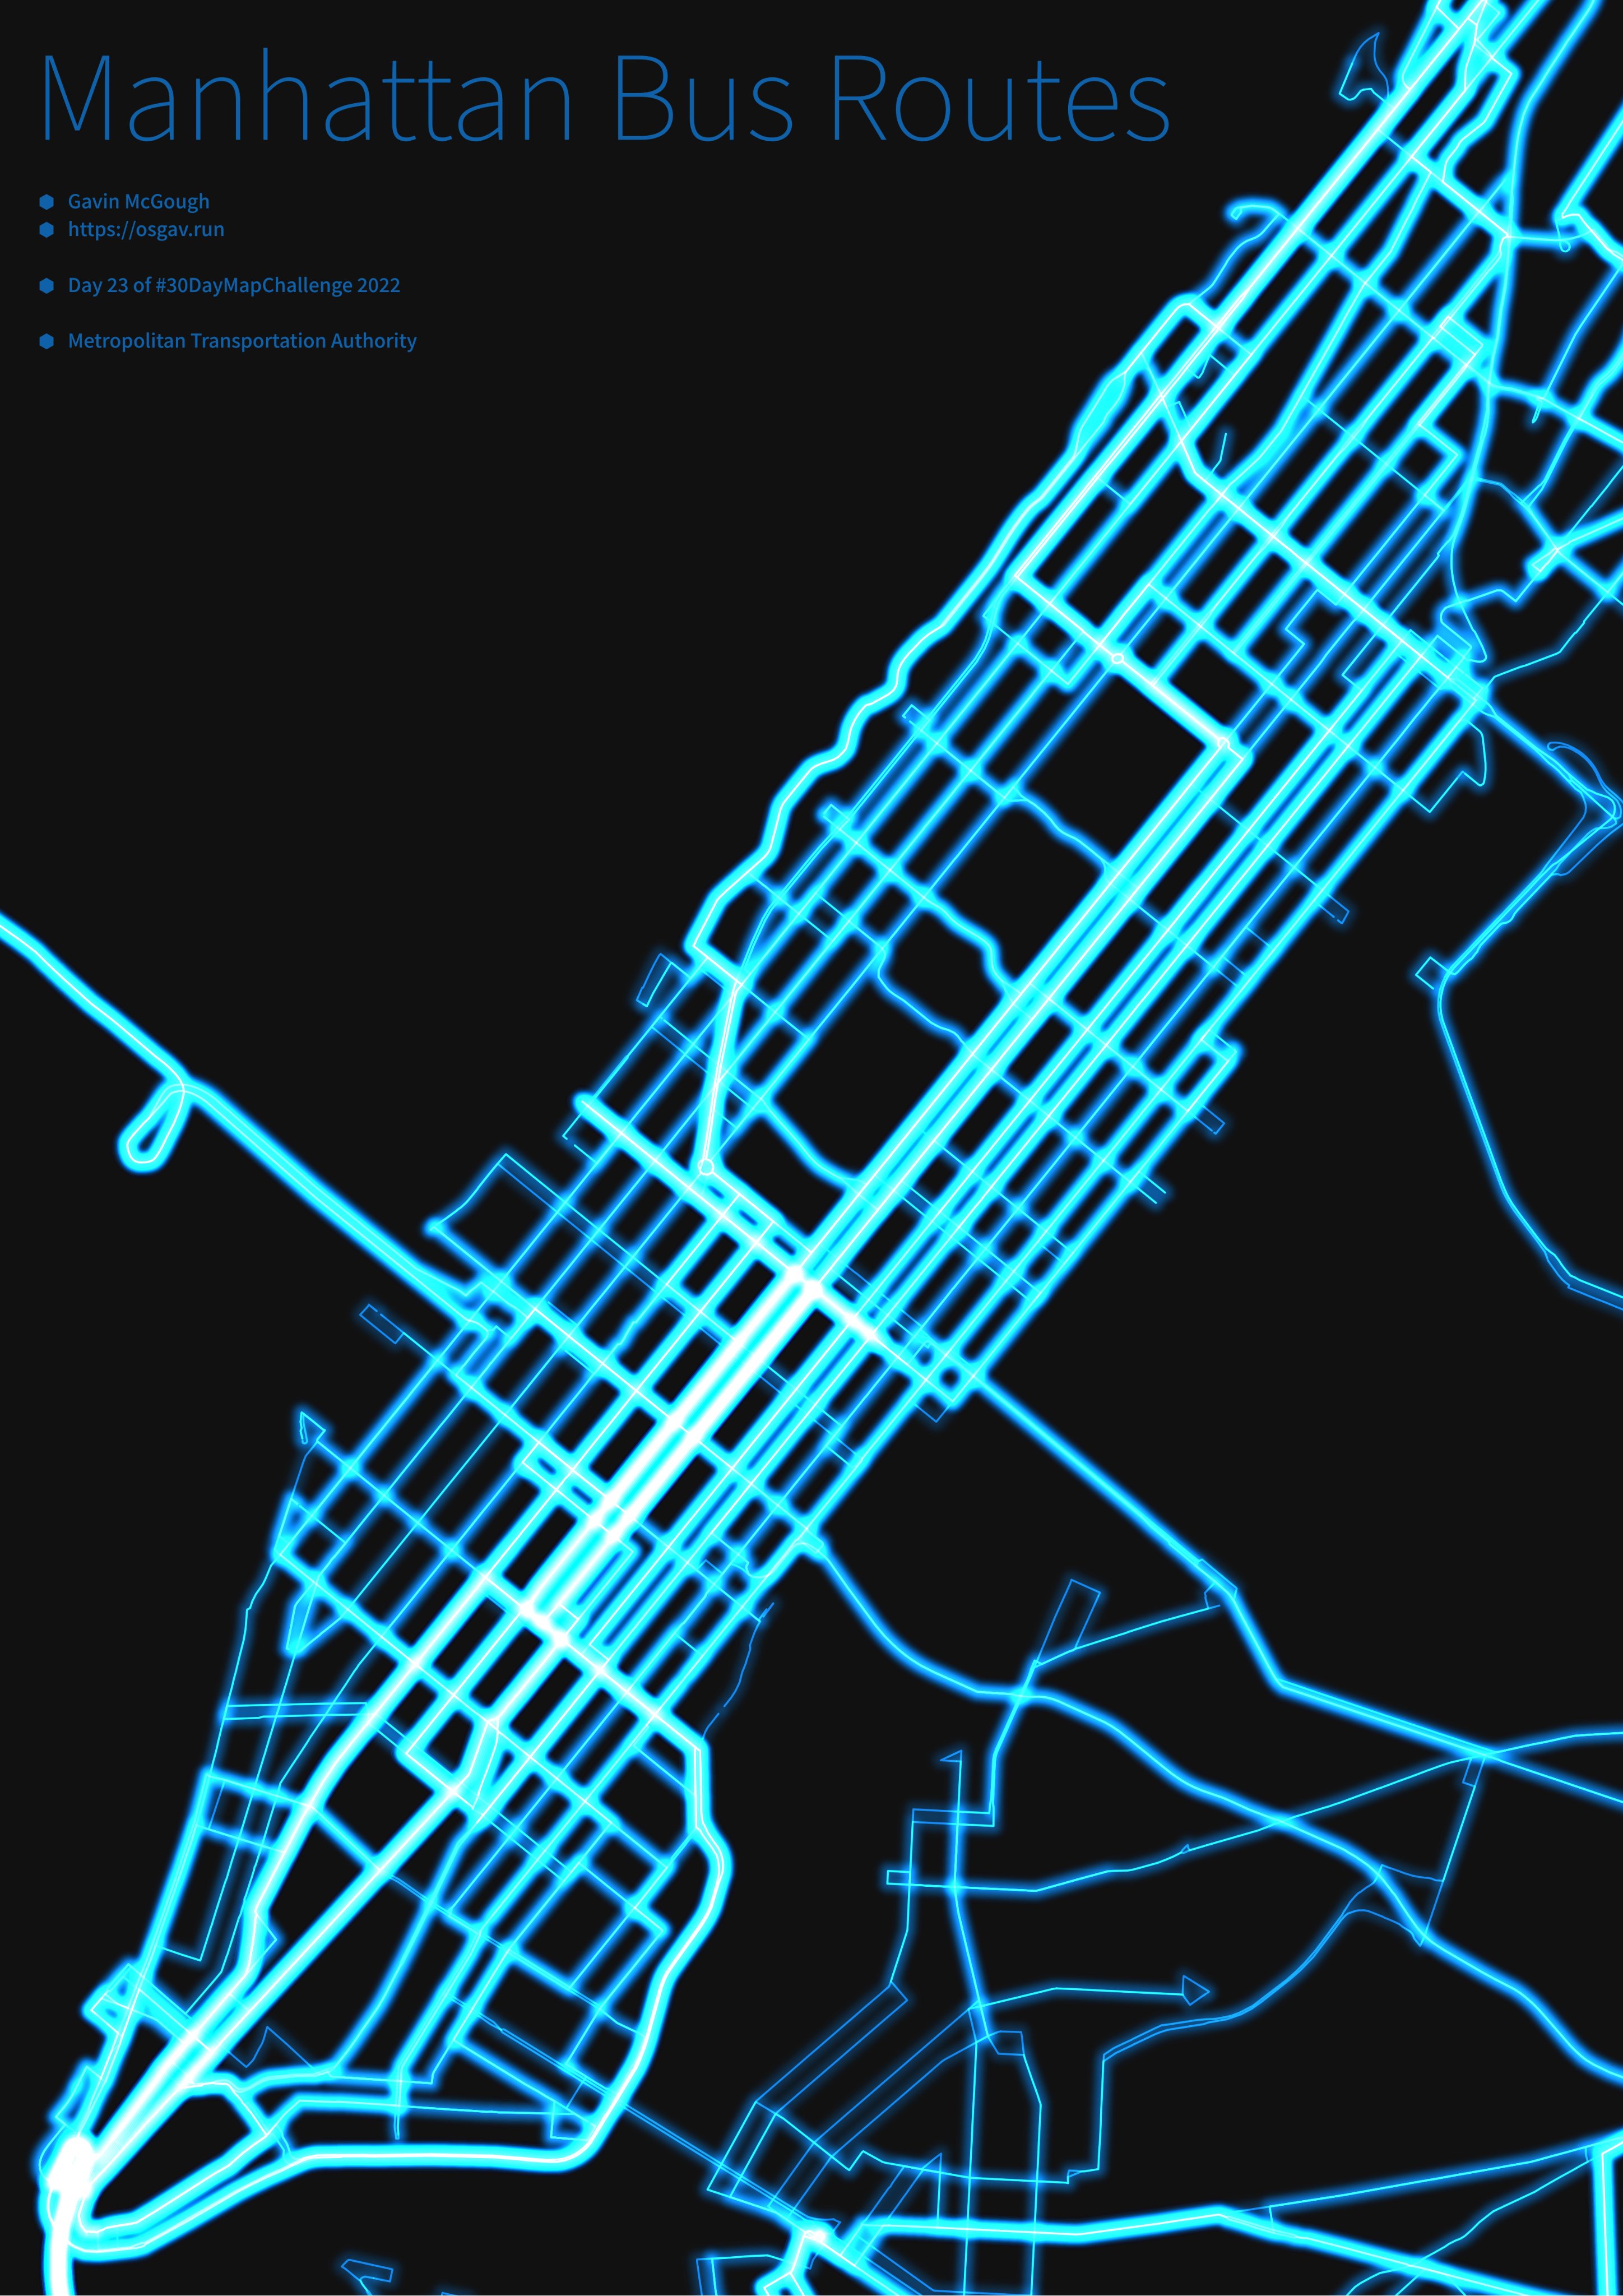
Data: Metropolitan Transportation Authority (look for “Bus GIS Shapefiles”)
Tools: QGIS
Techniques: set line style to Neon, remove inner glow, decrease width, change layer rendering blend mode for Feature to Addition, change colour to MTA blue
Inspiration: a similar style of map I saw once, and a tweet from @helenmakesmaps about blend modes
Related Links: https://www.helenmakesmaps.com/post/how-to-use-blending-modes-in-mapping
Social Media: view on Twitter or Mastodon
Tuskchester #
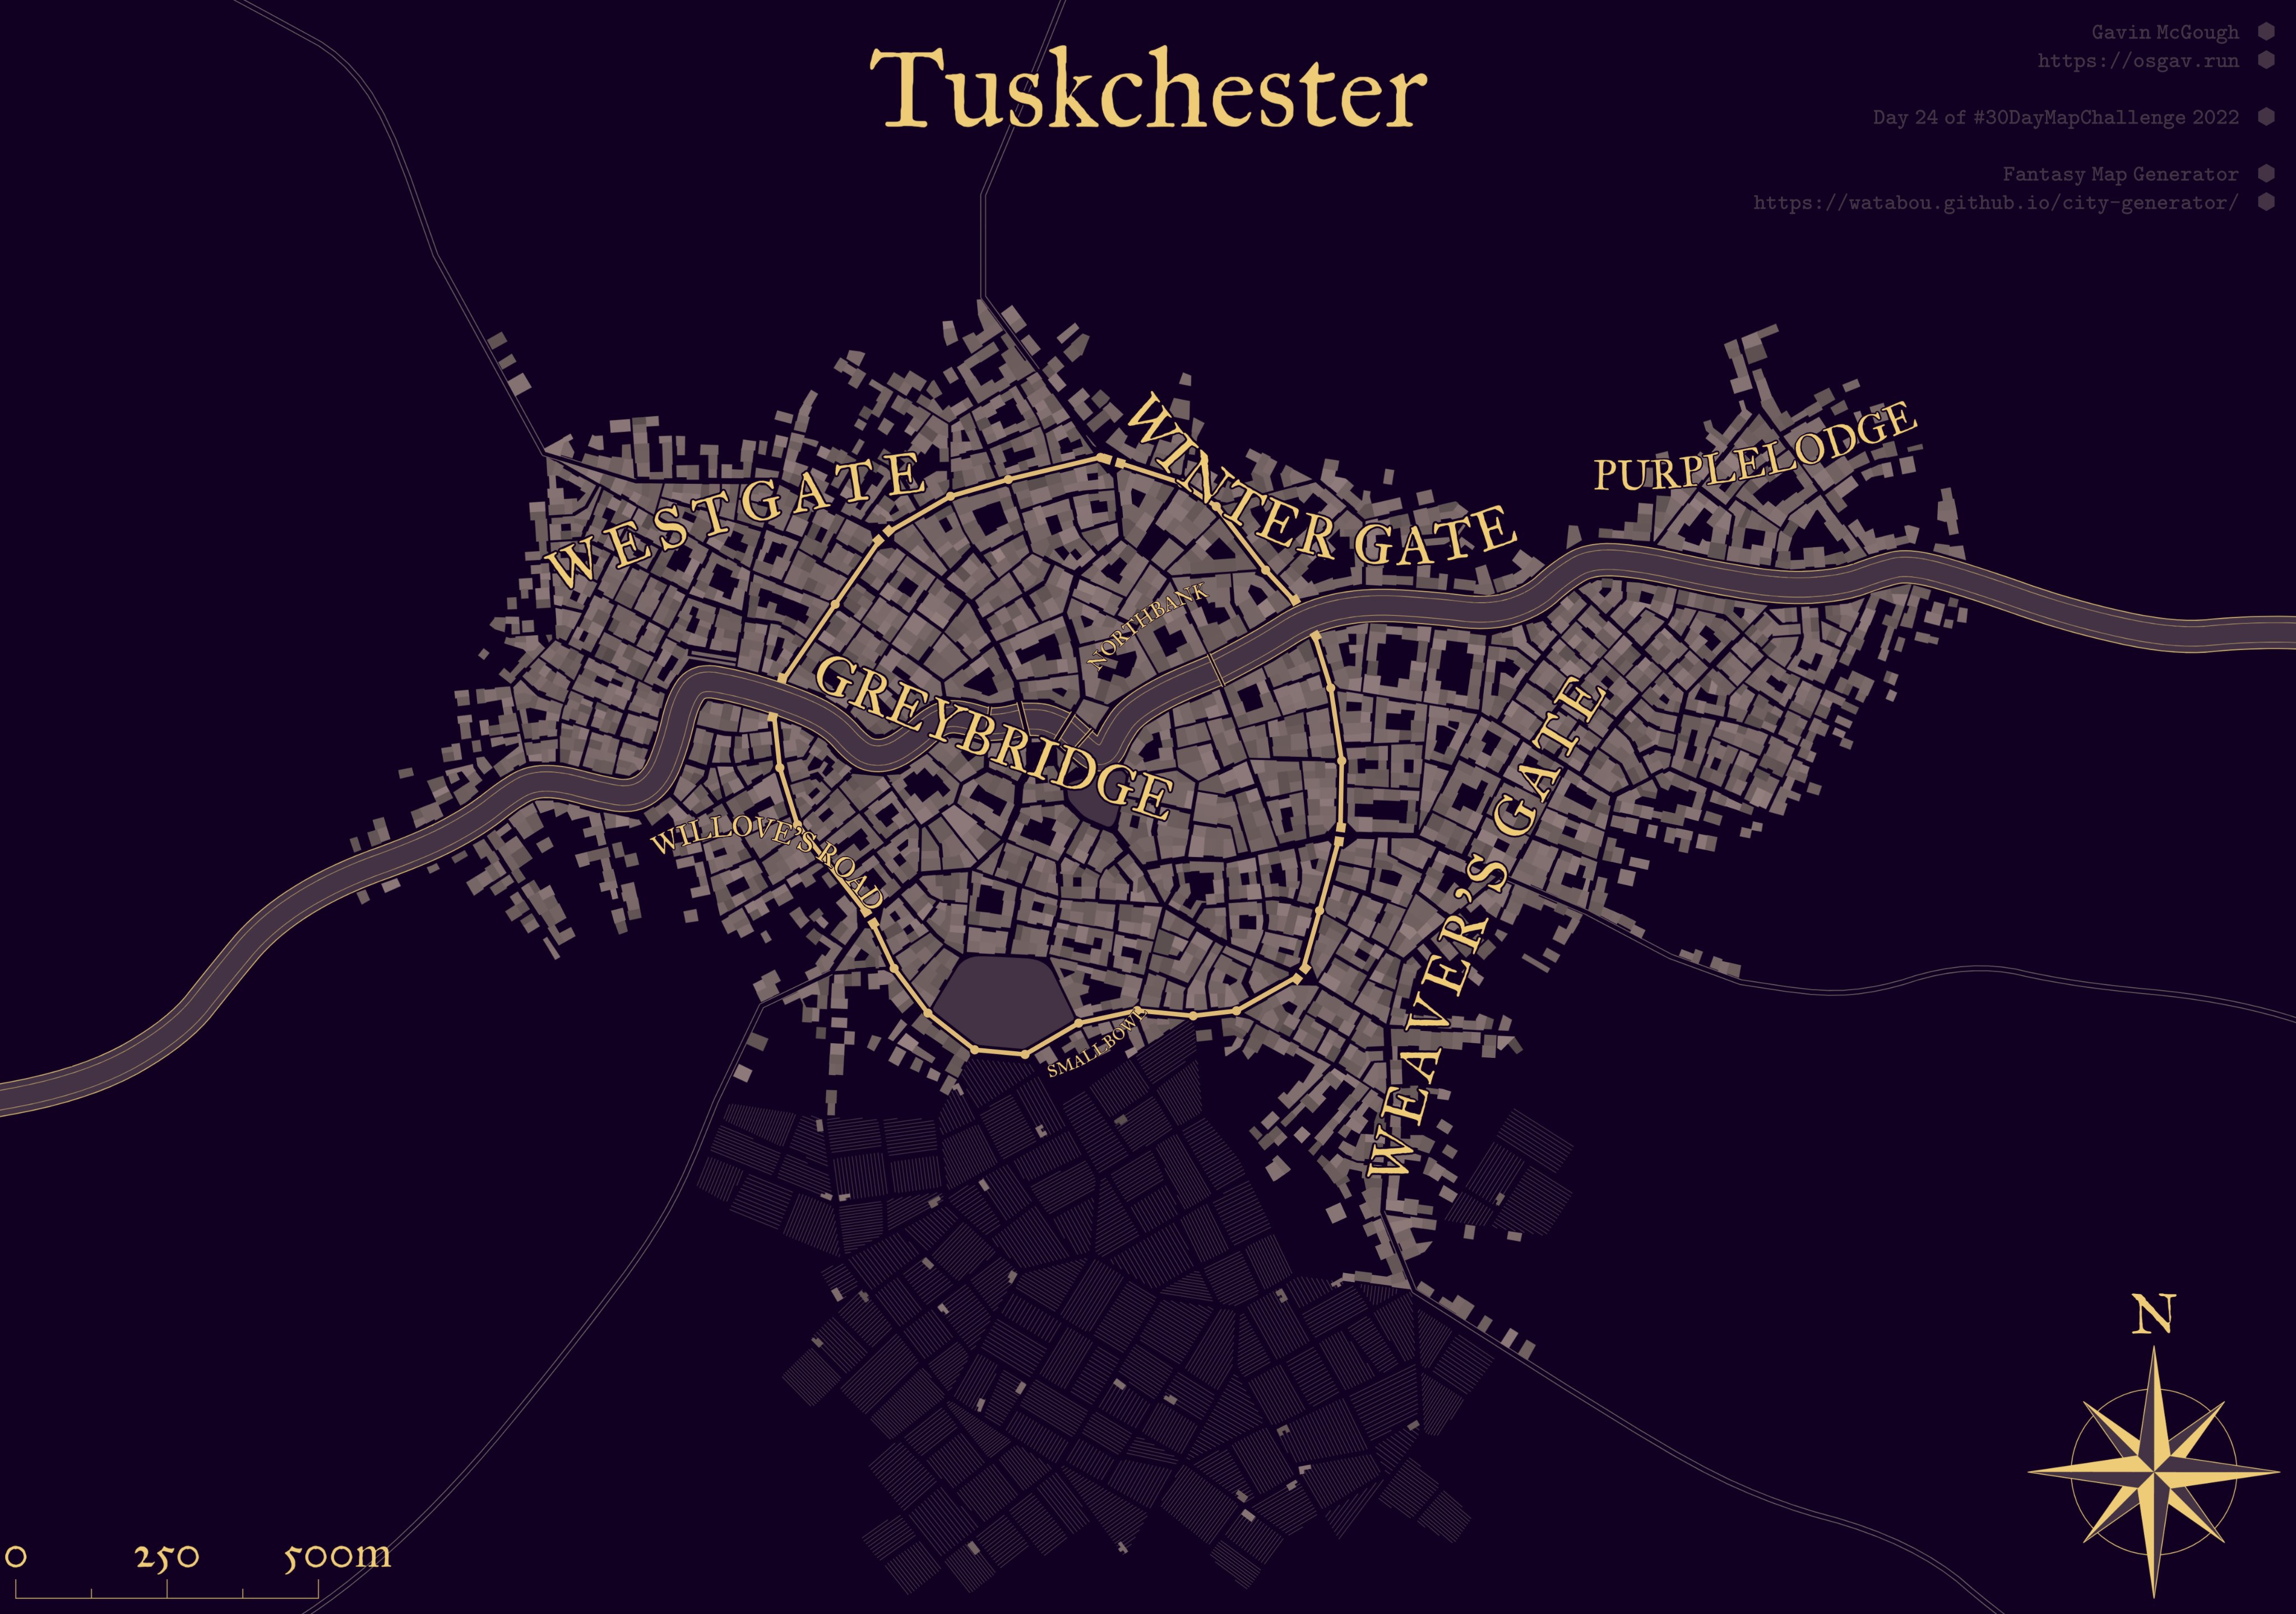
Data: fictional
Tools: https://watabou.github.io/city-generator/
Techniques: play with all the settings
Social Media: view on Twitter or Mastodon
Shetland Islands #
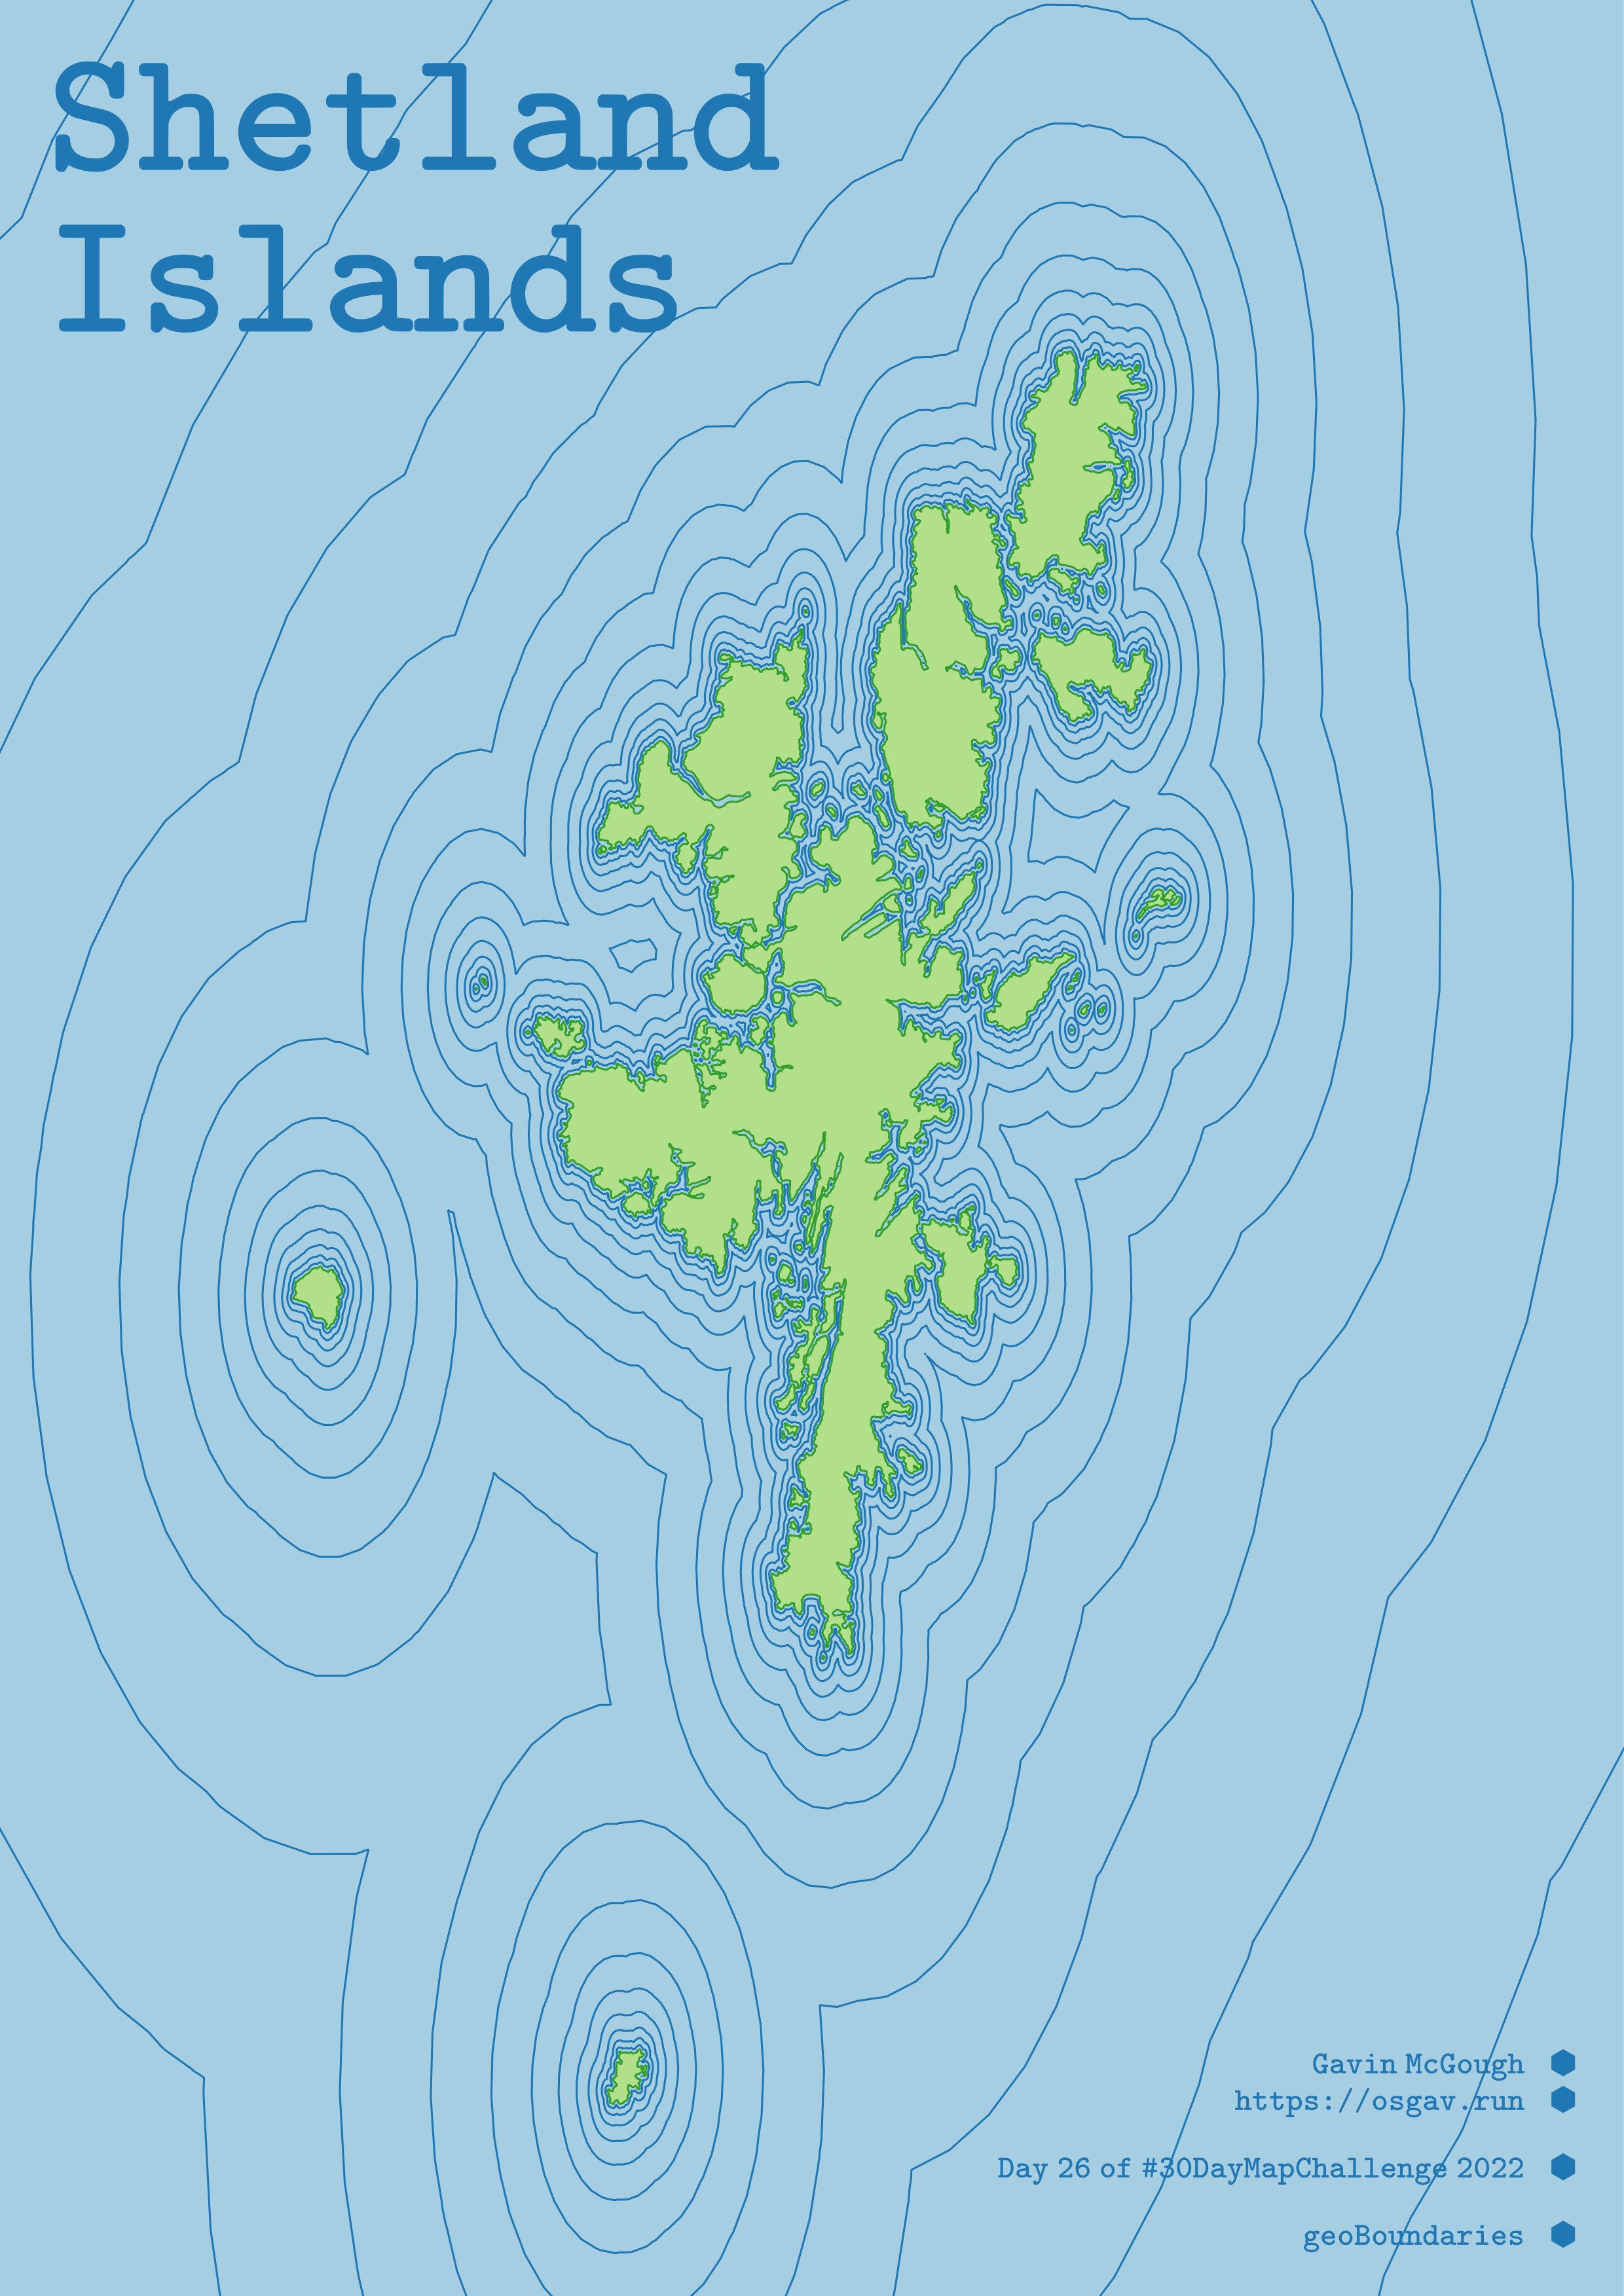
Data: geoBoundaries
Tools: QGIS
Techniques: played with the python function from bbecquet (link below)
Inspiration: https://mapstodon.space/@acrobins/109409424691052116
Related Links: https://bbecquet.net/articles/2021/07/waterlining-in-qgis/
Social Media: view on Twitter or Mastodon
Remix #
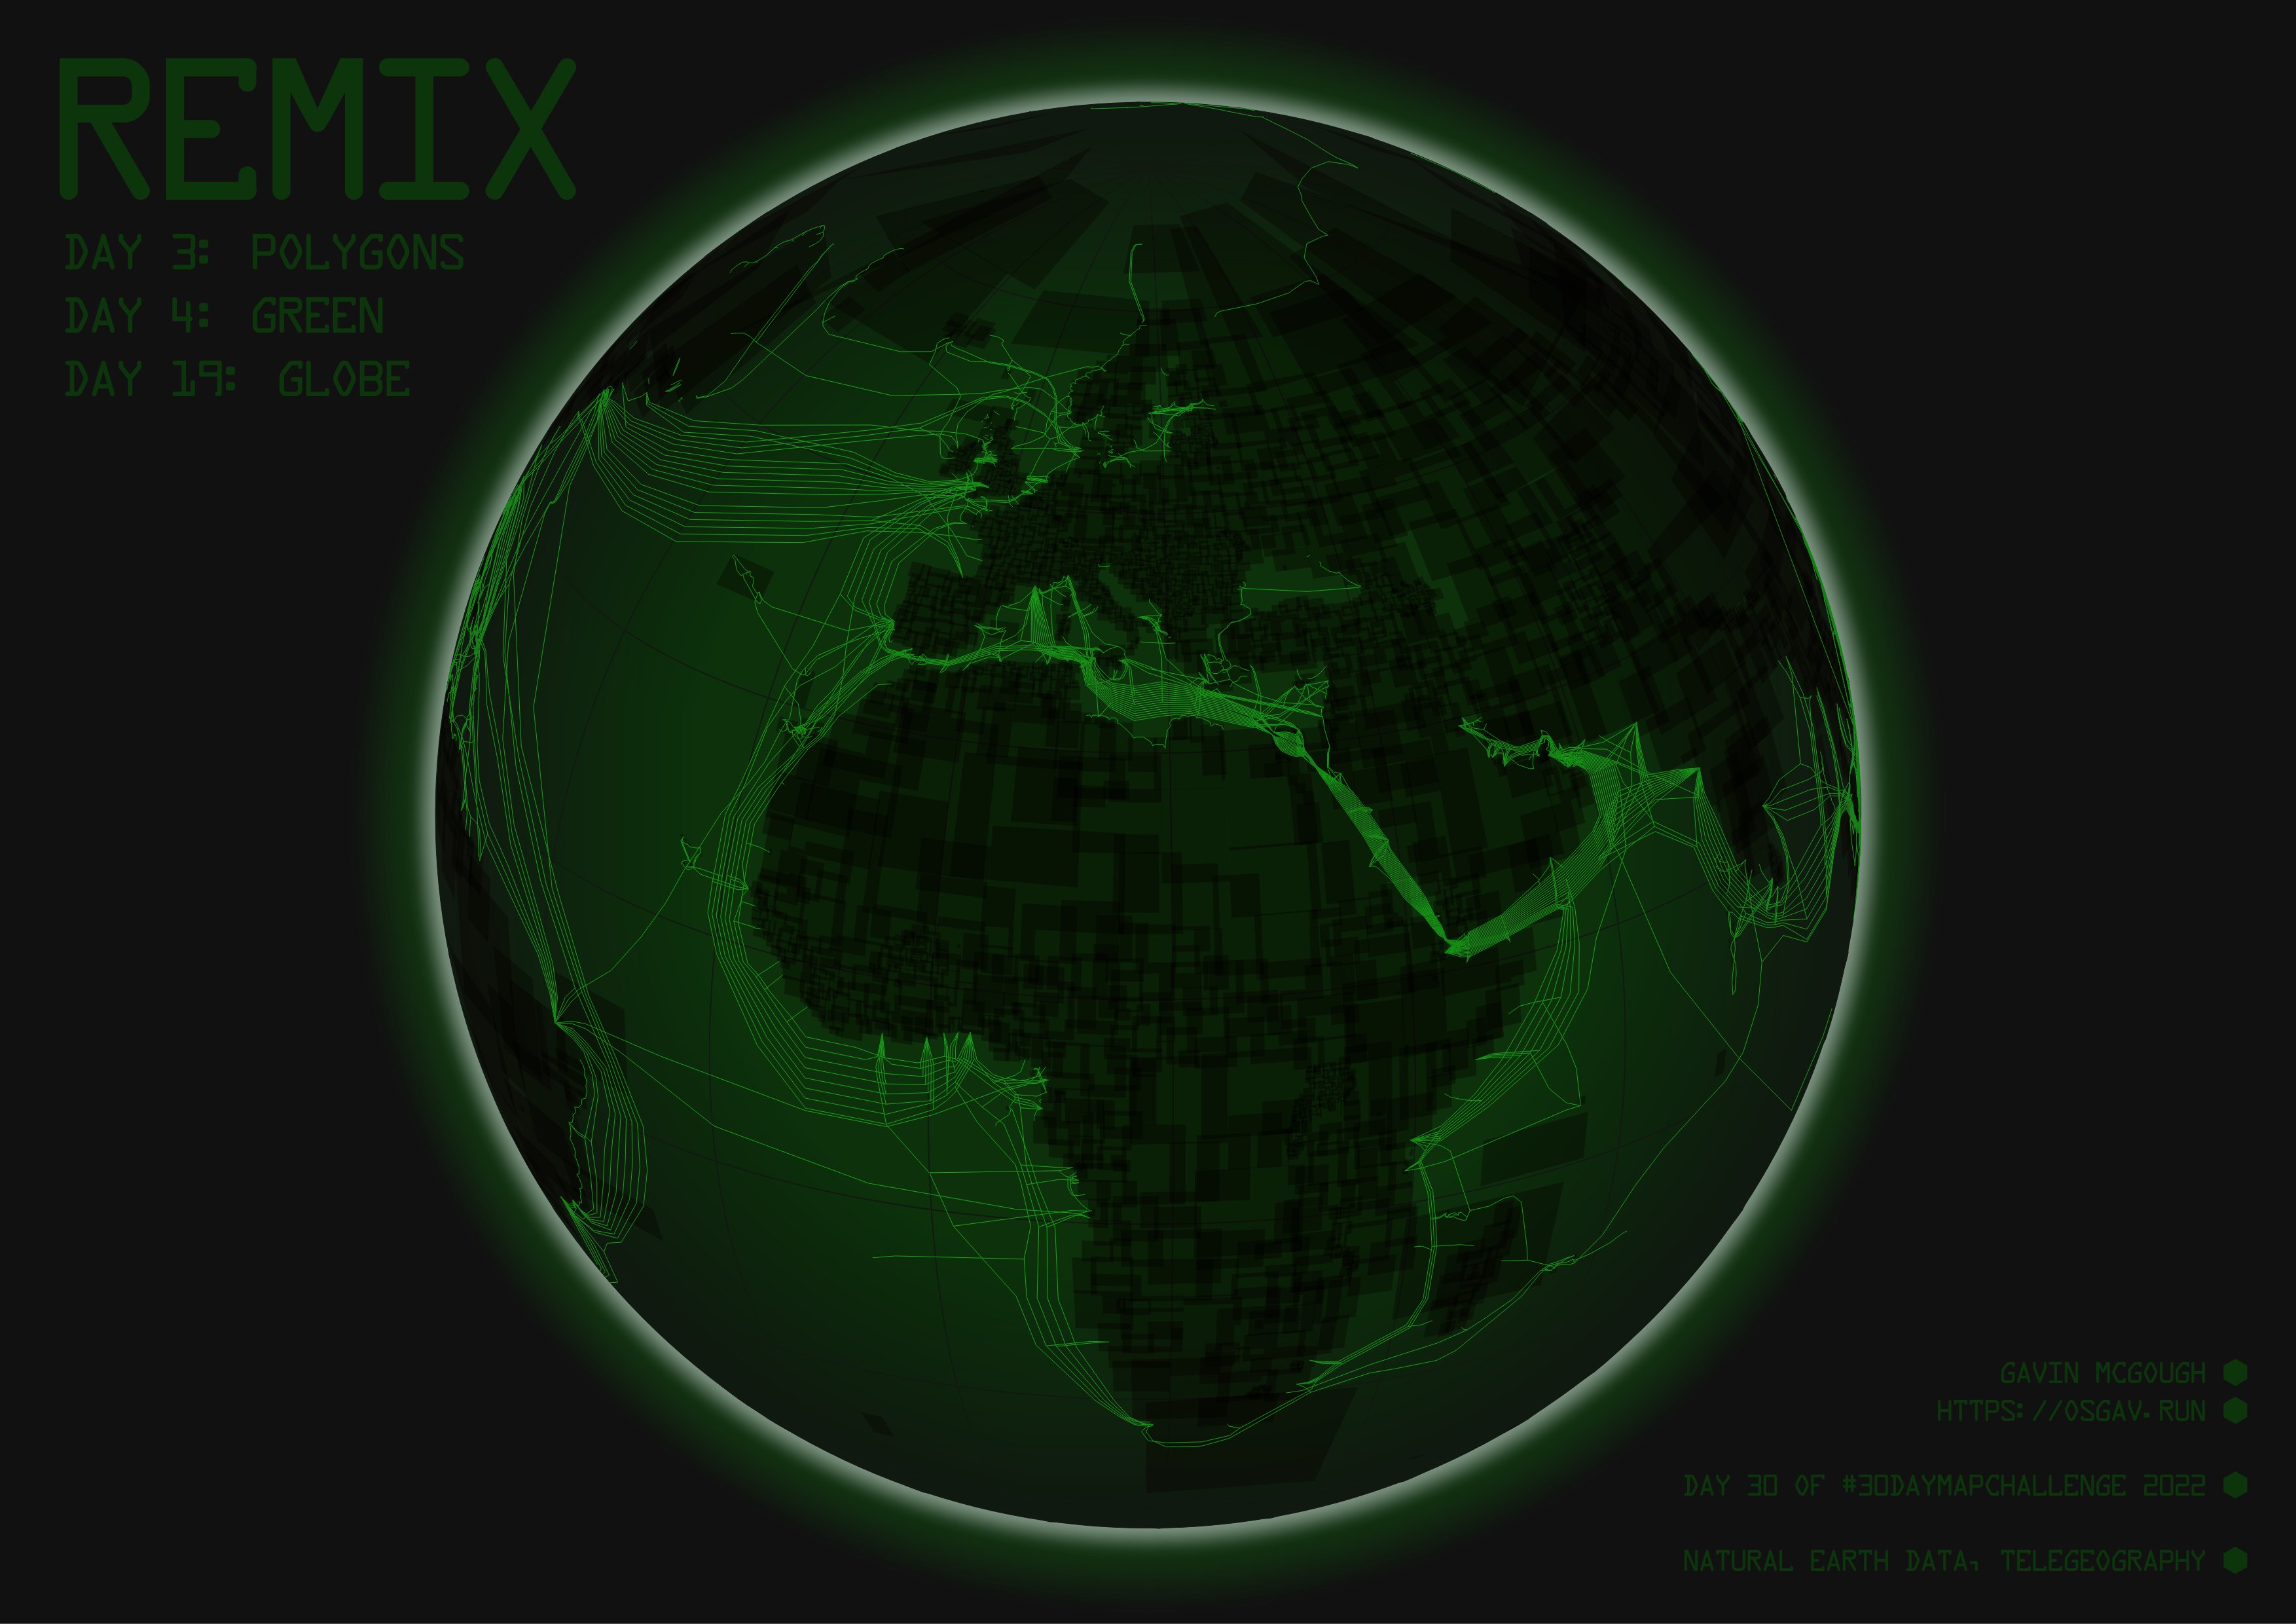
Data: Natural Earth, TeleGeography (they shutdown this repo between last month and now it seems, their FAQ states they no longer maintain and update a repo on GitHub, so I guess https://www.submarinecablemap.com/ itself is the source for it now)
Tools: QGIS, Globe Builder plugin
Techniques: same as Bounding Boxes map for Day 3: Polygons, just different colours
Inspiration: 3 of my maps from earlier in the month: Bounding Boxes, Access Granted, and The Information Superhighway
Social Media: view on Twitter or Mastodon
20 out of 30 #
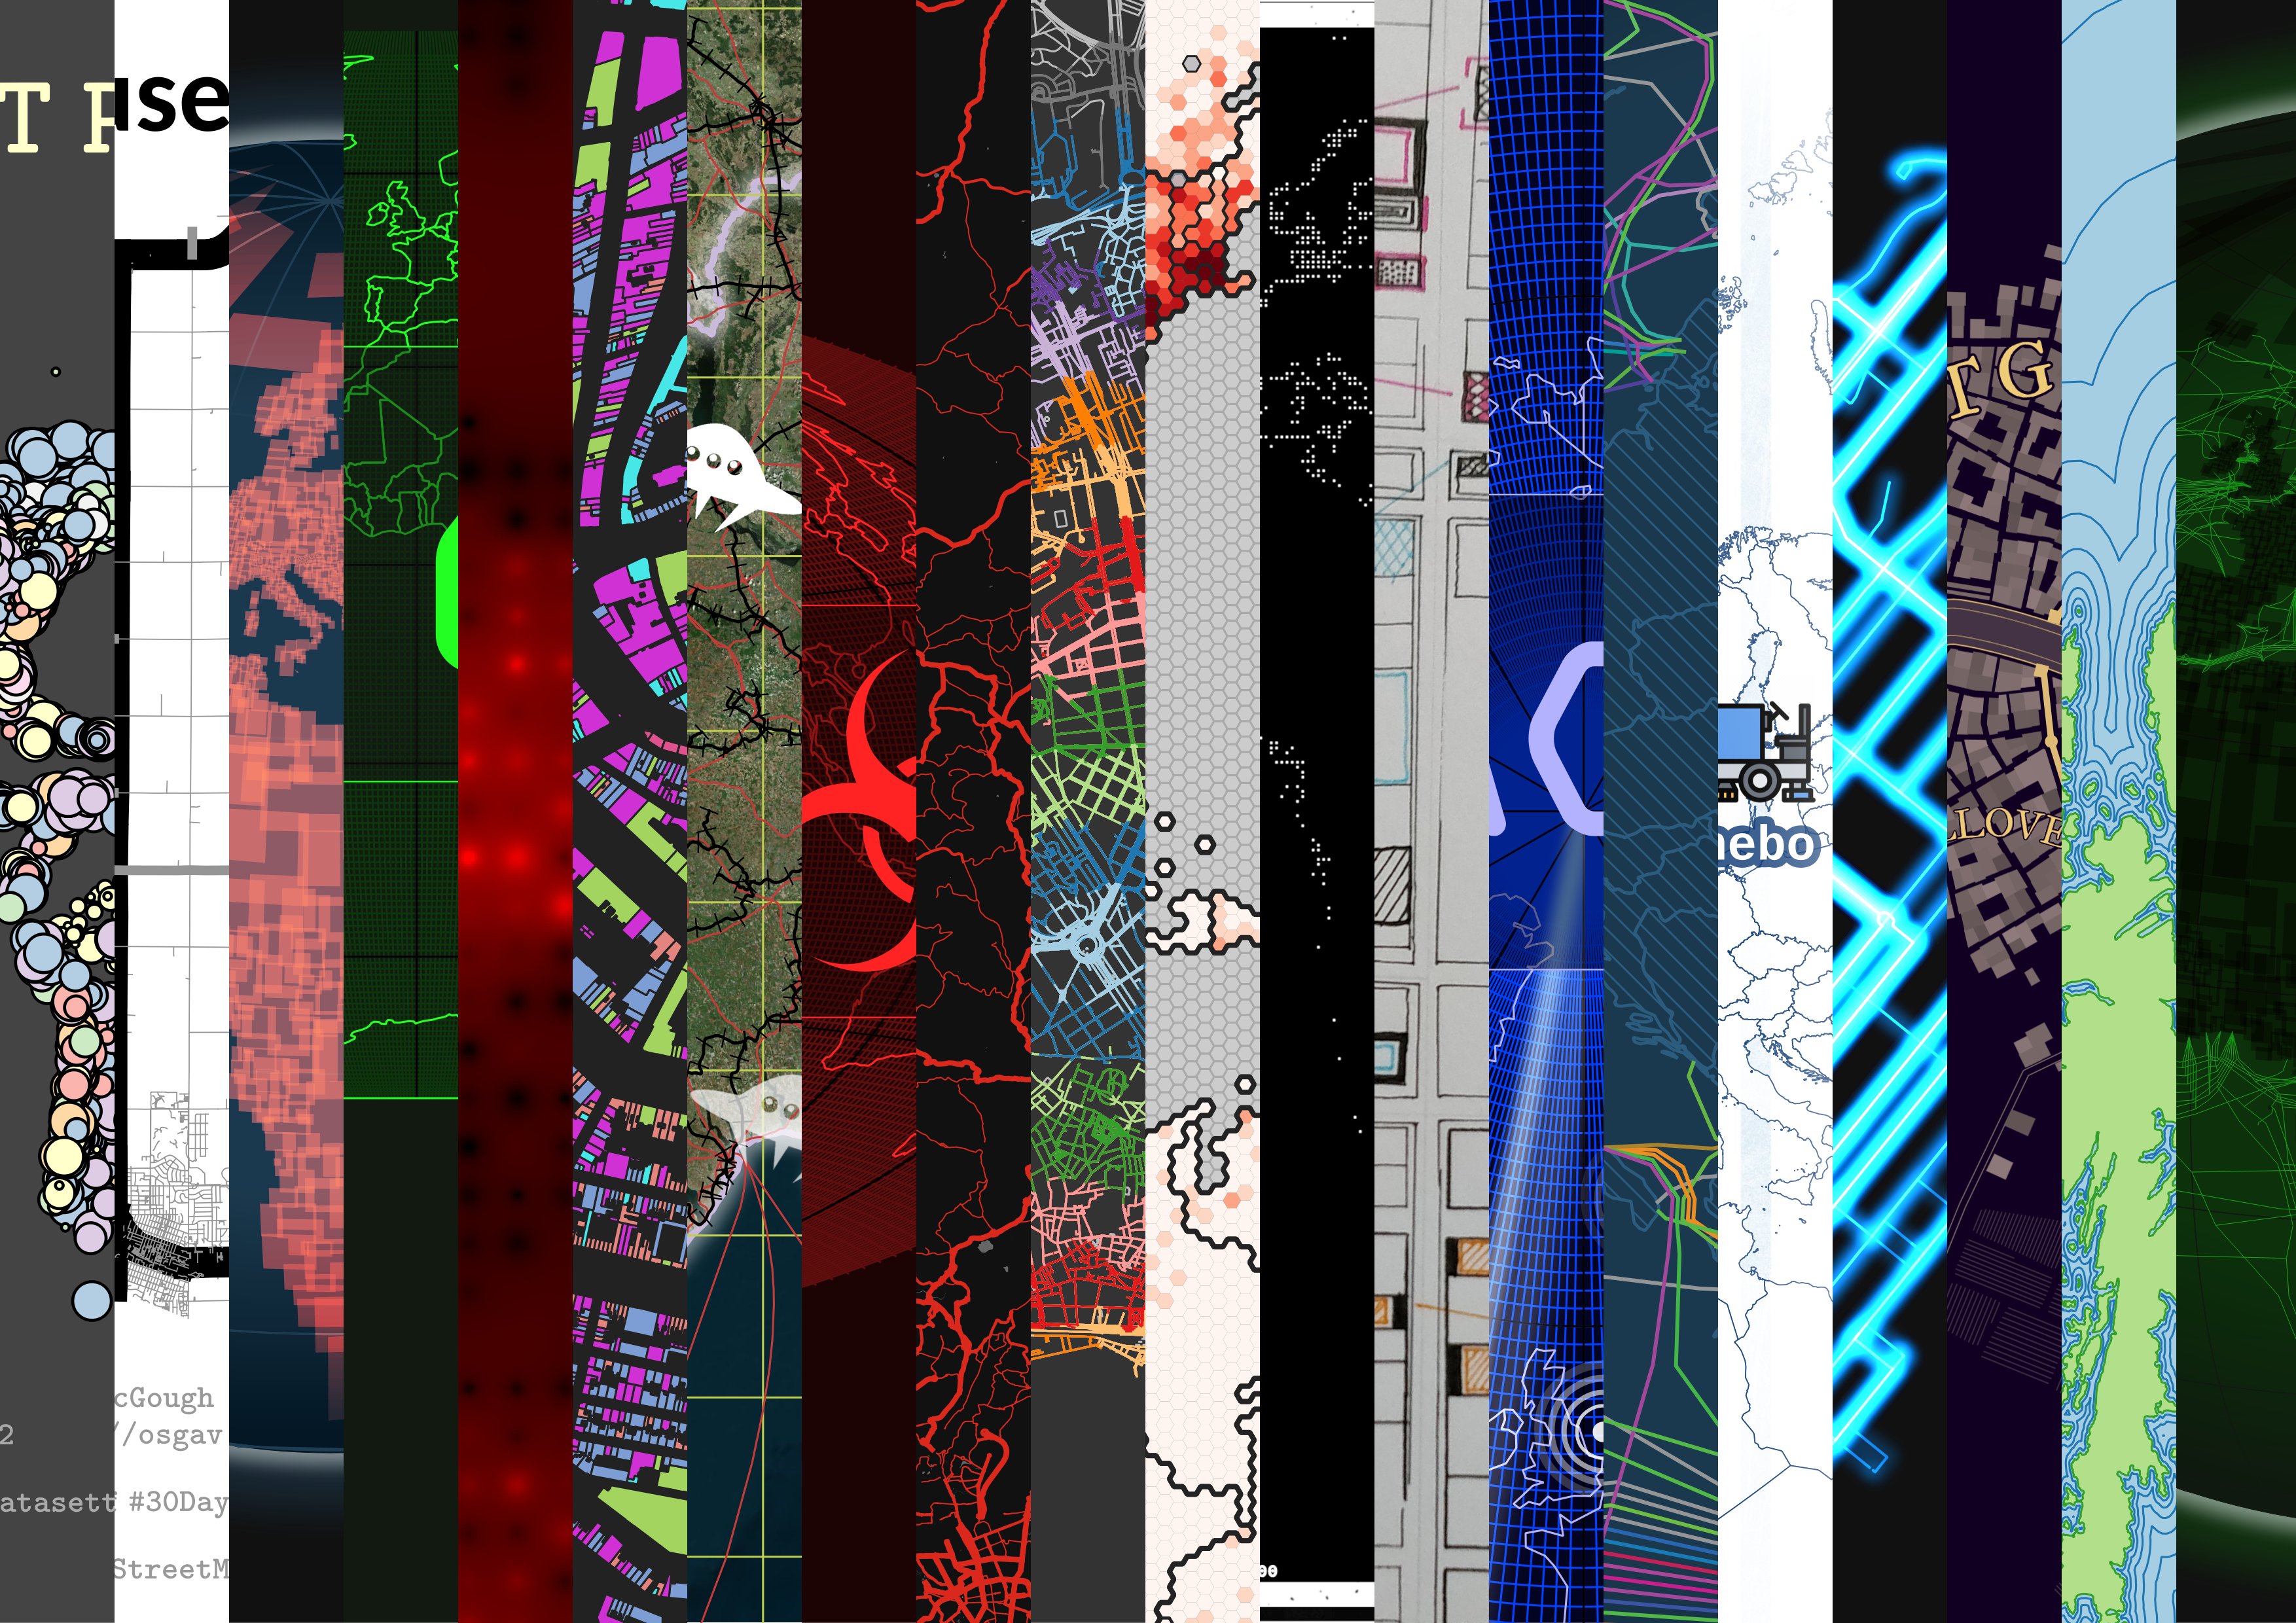
I have to admit, a chunk of my motivation came from the idea of making this at the end of the month. It was inspired by Nelson Schäfer who did it in 2021.
As promised here are a few links to some other such posts if you want to look at more maps:
2021:
- https://gisforthought.com/category/30daymapchallenge/
- https://www.helenmakesmaps.com/post/30daymapchallenge-2021-top-picks
- https://bogind.blogspot.com/2021/11/pokemaps-combining-30daymapchallenge.html
2022:
- https://david.frigge.nz/3RDayMapChallenge/
- https://ivabrunec.github.io/30daymap.html
- https://github.com/curatedmess/30DayMapChallenge
- https://antoniosmi.myportfolio.com/30daymapchallenge
- https://maptheclouds.com/playground/30-day-map-challenge-2022/meta/
- https://www.andrewdc.co.nz/project/30-day-map-challenge-2022/
- https://github.com/leeolney3/30DayMapChallenge
- https://github.com/petraduriancikova/30DayMapChallenge
That is but a fraction of collections from folks whose maps I saw this year – there will be a whole load more uploaded to the official 30DayMapChallenge website very soon (and of course previous years’ collections are there right now).
Happy mapping!